This page is not compatible with Internet Explorer.
For security reasons, we recommend that you use an up-to-date browser, such as Microsoft Edge, Google Chrome, Safari, or Mozilla Firefox.
What's New in VGinLINE
Discover the Exciting New Capabilities of Version 2022.2 (as of June 2022)
Version 2022.2 of VGinLINE is now available. In version 2022.2, you will benefit from the following new capabilities*:
Filter
Increased Erode/Dilate Radius
Increased Erode/Dilate Radius
Use the "Erode/dilate" function for ROIs with a radius of up to 32 voxels. The increased radius means you no longer have to perform the function multiple times.
Coordinate Measurement

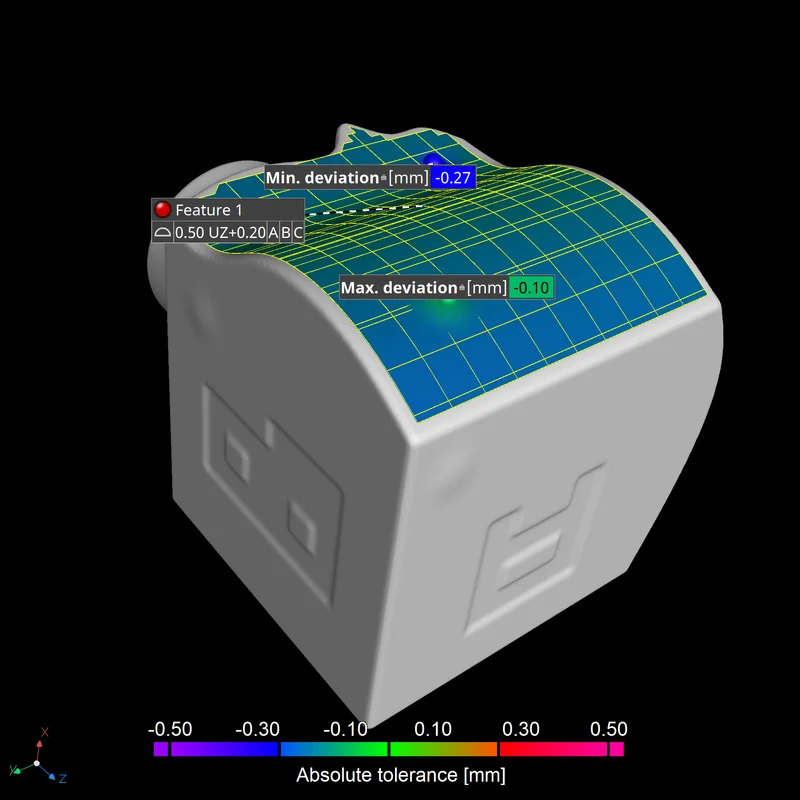
Native Support for Nonsymmetric Tolerance Zones
Measure unequally disposed tolerance zones of profile tolerances. You can now inspect nonsymmetric tolerance zones of profile tolerances in a single step and at the same time define the tolerance zone more accurately. Additionally, the standard UZ modifier is supported in the tolerance callout.
Porosity/Inclusion Analysis
P 203 Porosity Analysis Supports "From defect ROI"
You can now evaluate defect masks—described by an ROI—with the P 203 analysis. This allows you to use the convenient standardized key-based tolerance specification method of the P 203 analysis to evaluate defect masks obtained via arbitrary methods, for example, via external analyses.
Slice Area Analysis

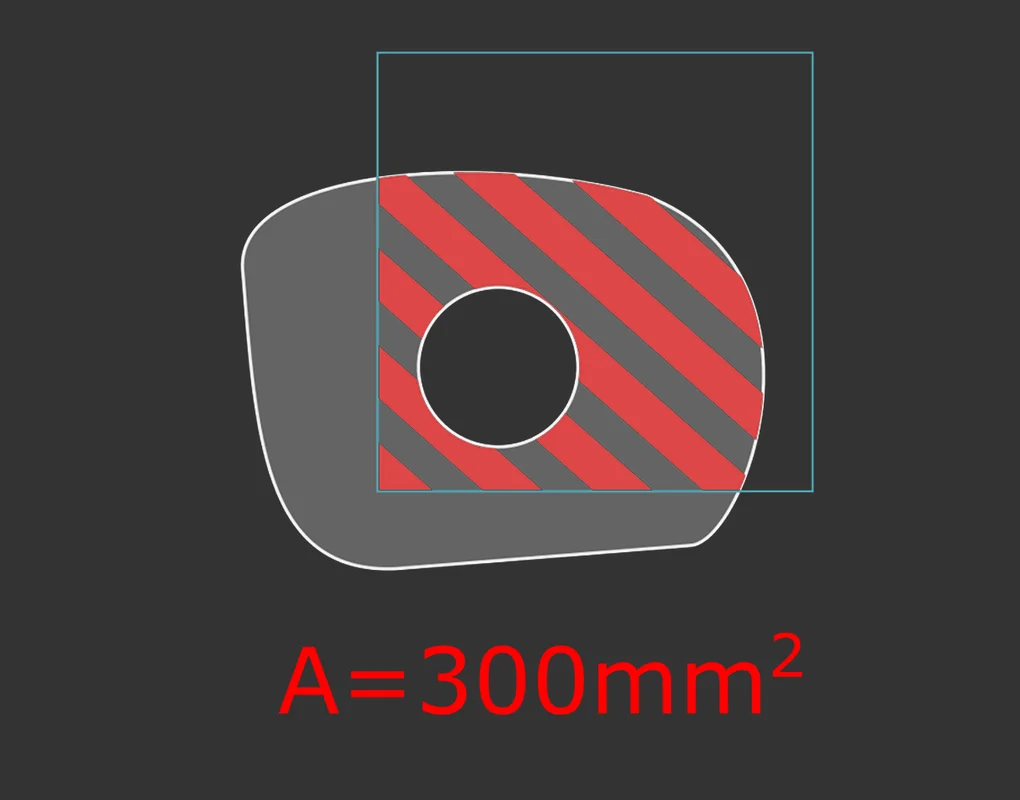
New Slice Area Analysis
Easily measure the area of a cross section. With our new slice area analysis, you now have a way of calculating the area of a region of interest (ROI) or a volume or the area enclosed by the surface determination in a slice.
Reporting and Traceability
Sorting of Features Either by ID or by Name in Q-DAS Export
Export coordinate measurement features in the Q-DAS ASCII transfer format in a sensible order. This allows you to define the coordinate measurement features in an order that fits your workflow without having to use this same order in exported Q-DAS files.
Part Information for All Features in Q-DAS Export
Export results in the Q-DAS ASCII transfer format and associate them with part information. This provides more complete information about individual features used in statistical process control by storing relevant part information for all of them, instead of only the first one.
Vertical Lines in Report Tables
The new option to show vertical lines for tables in reports allows for a clearer visual separation of the data in result tables and makes it easier to navigate in tables that consist of many columns.
FAQ for the Integrated Reporting
Get started with and learn more about the integrated reporting with our new FAQ page. This page helps you to quickly become productive with the integrated reporting by providing answers to frequently asked questions in one easily accessible location and gives a good overview of the integrated reporting's capabilities.
Coloring for Tolerancing in Coordinate Measurement Tables in Reports
Create easy-to-understand reports of coordinate measurement results. Coloring for tolerancing immediately highlights the tolerance states of the measured features in a report table and thus makes it easy to focus on the most relevant results.
Overview Tables for Analyses in Reports
Analyze multiple parts or regions in the same way with either porosity/inclusion analysis, nominal/actual comparison, wall thickness analysis, fiber composite material analysis, gray value analysis, or ASTM and report the results. Overview tables for analyses allow for an intuitive comparison of similar results at a single glance and remove the need for external tools to create comparison tables.
*Depending on the platform, there are differences in the range of functions for different operating systems. See our continuously updated Product Information page for details.
Volume Graphics GmbH
Speyerer Straße 4-6
69115 Heidelberg
Germany
Phone: +49 6221 73920 60
Fax: +49 6221 73920 88
Sales enquiries:
sales@volumegraphics.com
Modifications and errors reserved.
