This page is not compatible with Internet Explorer.
For security reasons, we recommend that you use an up-to-date browser, such as Microsoft Edge, Google Chrome, Safari, or Mozilla Firefox.
What's New in VGSTUDIO MAX
Discover the Exciting New Capabilities of Version 3.4 (as of February 2021, Version 3.4.5)
Support of BDG Reference Sheet P 203 (New in 3.4.5)
Now, you can inspect cast parts for porosity according to the Reference Sheet P 203 of the Federation of German Foundry Industry (BDG) and perform a 3D evaluation with regard to the most critical defect parameters within functional areas of the part. The new P203 analysis within our Extended Porosity/Inclusion Analysis Module allows you to generate porosity keys using an intuitive interface, define a reference volume exactly according to the inspection plan using the ROI functions of VGSTUDIO MAX, and get a quick overview of all global tolerancing criteria and results for the P 203 analysis. The new P203 analysis includes porosity tolerance per region, equivalent defect diameter, and the total number of defects as tolerancing parameters.
New Porosity/Inclusion Analysis Features (New in 3.4.5)
The new P203 analysis within the Extended Porosity/Inclusion Analysis Module includes defect evaluation and independent tolerancing of different ROIs within one P 203 analysis, the ability to more flexibly combine the tolerancing and filtering of defects based on their characteristics, and the option to evaluate freeform reference volumes (ROIs) only inside the object's boundaries (surface), which makes it easy to set up a fully automated in-line inspection. To efficiently and flexibly inspect your part, the P 203 analysis function is equipped with additional features such as porosity and hot spot calculation, distance to machined surface, annotations, and bookmark image generation. Like VGEasyPore, P 203 offers new subvoxel accuracy and absolute and relative defect contrast definition.
From Drawing to Statistical Process Control (New in 3.4.5)
With the added support for BDG Reference Sheet P 203, VGSTUDIO MAX together with Q-DAS qs-STAT cover the complete loop from the specification of porosity tolerancing criteria according to P203 by the product designer to statistical process control by the quality engineer. Now, it's possible to easily transfer tolerancing criteria for porosities from drawings to the software without errors. The tolerancing keys in the drawing are displayed in the software and an overview of the corresponding tolerancing results is displayed in one easy-to-understand table. The results of a P 203 analysis can be exported to the Q-DAS software qs-STAT for statistical process control.
Reporting of P 203 Results (New in 3.4.5)
The results of a P 203 analysis can be documented using Reporting via Excel—or the new integrated reporting function. Introduced in version 3.4.4, the completely new integrated reporting function lets you edit and view reports in Volume Graphics applications exactly as they will appear in the PDF, customize them, automate their creation, and store them directly in your .vgl project. This allows you to report P 203 results along with a faithful representation of the overview table of tolerancing results.
Q-DAS Export for P 203 (New in 3.4.5)
The new P203 analysis supports export to Q-DAS right from the start so that you can qualify and statistically analyze your casting processes. Using the Q-DAS ASCII transfer format, VGSTUDIO MAX can export your P 203 tolerances and codes and the related global porosity analysis results.
Q-DAS Export for all Porosity/Inclusion Analysis Results (New in 3.4.5)
What goes for the new P203 analysis also applies to the other defect analyses of VGSTUDIO MAX. Now, it is possible to export toleranced, global porosity/inclusion analysis results and related tolerances in the Q-DAS ASCII transfer format for process qualification or statistical analysis in statistics software, such as qs-STAT from Q-DAS.
ROI-Specific Histograms for Volume Mesh Element Quality (New in 3.4.5)
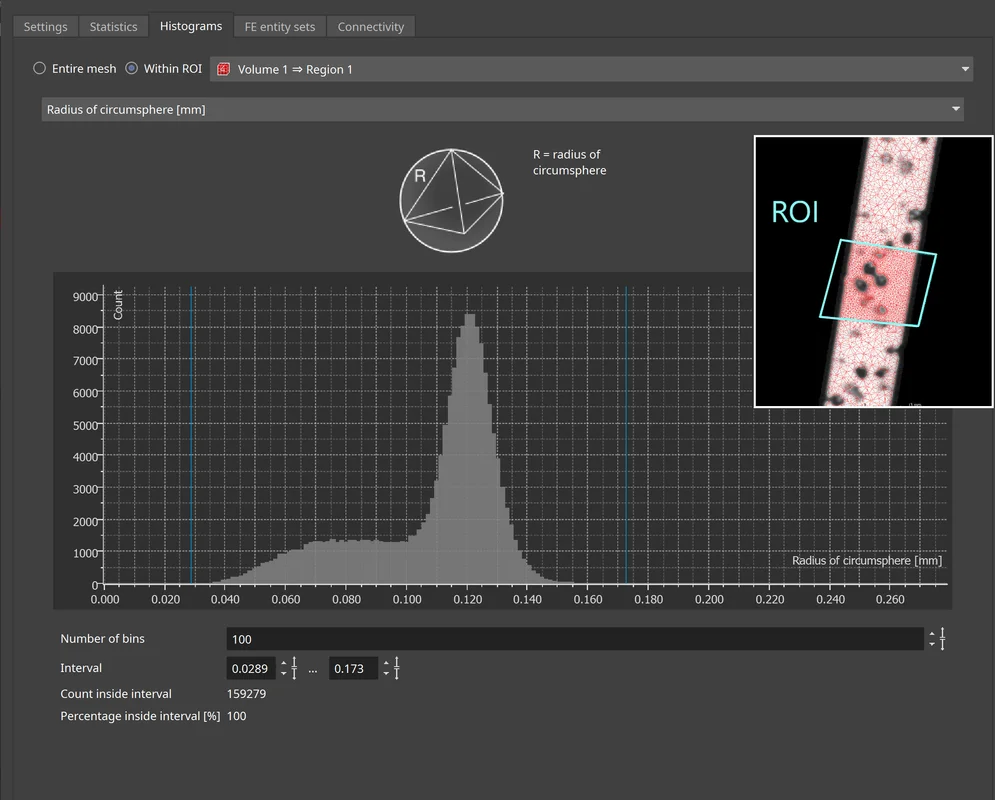
Inspect tetrahedral mesh element quality and element size specifically within an ROI by creating element quality histograms only for elements within the defined ROI. This avoids unnecessary meshing steps when different element quality acceptance criteria are specified for different zones within the component. For example, high element quality might definitely be required in a particular ROI, while some lower-quality elements might be acceptable in the rest of the part.
NASTRAN Export for Volume Meshes (New in 3.4.5)
Using NASTRAN export for volume meshes simplifies your workflow when building NASTRAN simulation models based on CT data. Now, you can directly use tetrahedral volume meshes created in VGSTUDIO MAX for NASTRAN simulations without using, for example, FE preprocessor software to convert them from PATRAN or ABAQUS formats into NASTRAN format.
Easy Mesh Comparison through Retained ROI Selection (New in 3.4.5)
The new ROI selection on the Histogram tab persists when you switch the mesh selection in the Scene Tree, which makes it easier to compare meshes. The option to check the mesh quality on either a specific ROI or the entire mesh remains activated when you toggle between volume meshes created using different settings. The specified interval for the element count is also retained. This makes inspecting and comparing tetrahedral meshes even more convenient when creating high-quality volume meshes.
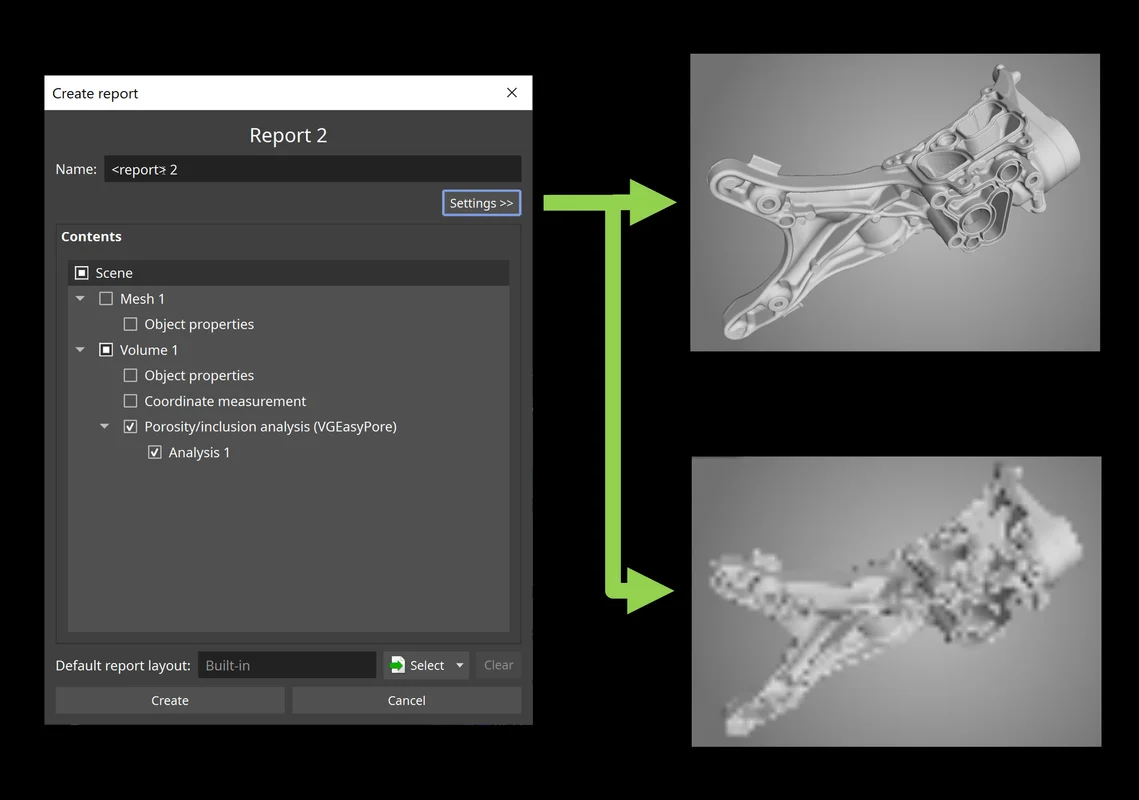
Image Generation Settings in New Reporting (New in 3.4.5)
Custom image generation settings, such as for resolution and opacity mapping, are now also available for the new integrated reporting function and can be specified for individual objects or for the entire report. This way, image creation is consistent even in automation scenarios and reporting the same content using different settings is easily possible.
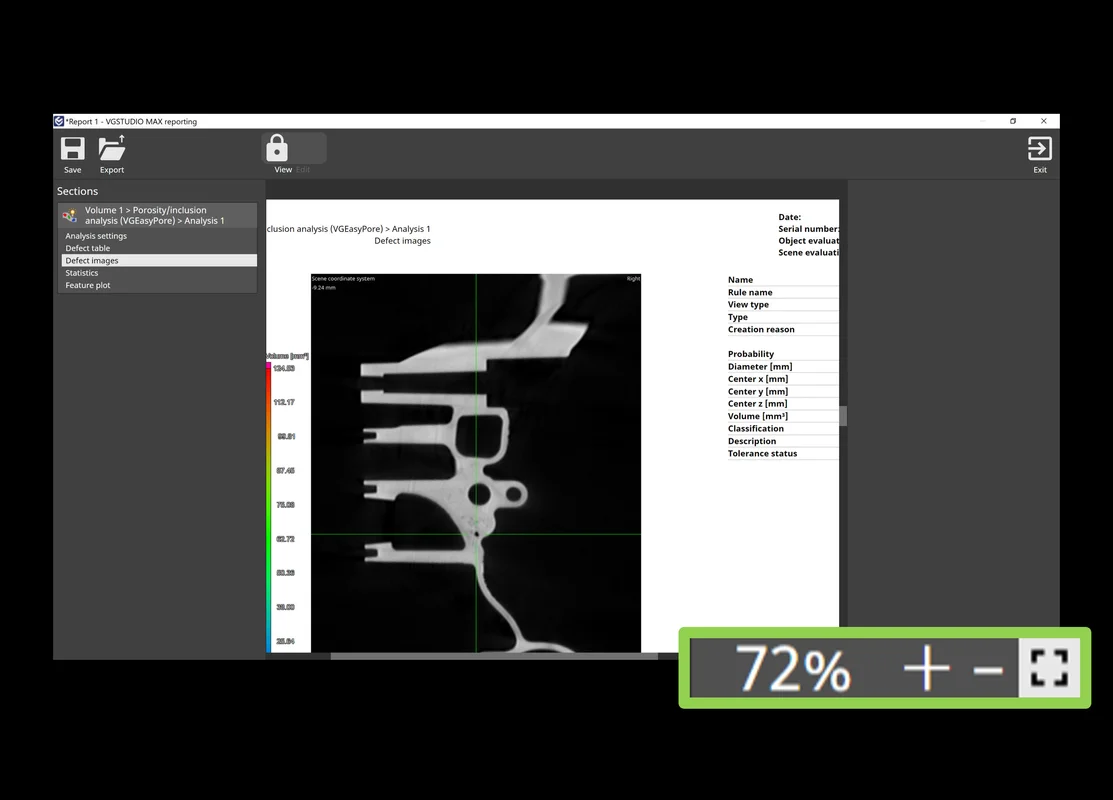
Zoom Function in Report Editor (New in 3.4.5)
The new zoom function in the WYSIWYG (What You See Is What You Get) editor lets you easily fit relevant content to your screen while viewing or editing a report. It automatically scales the report pages to fit the available space or allows you to set a manual zoom level depending on the level of detail you want to see.
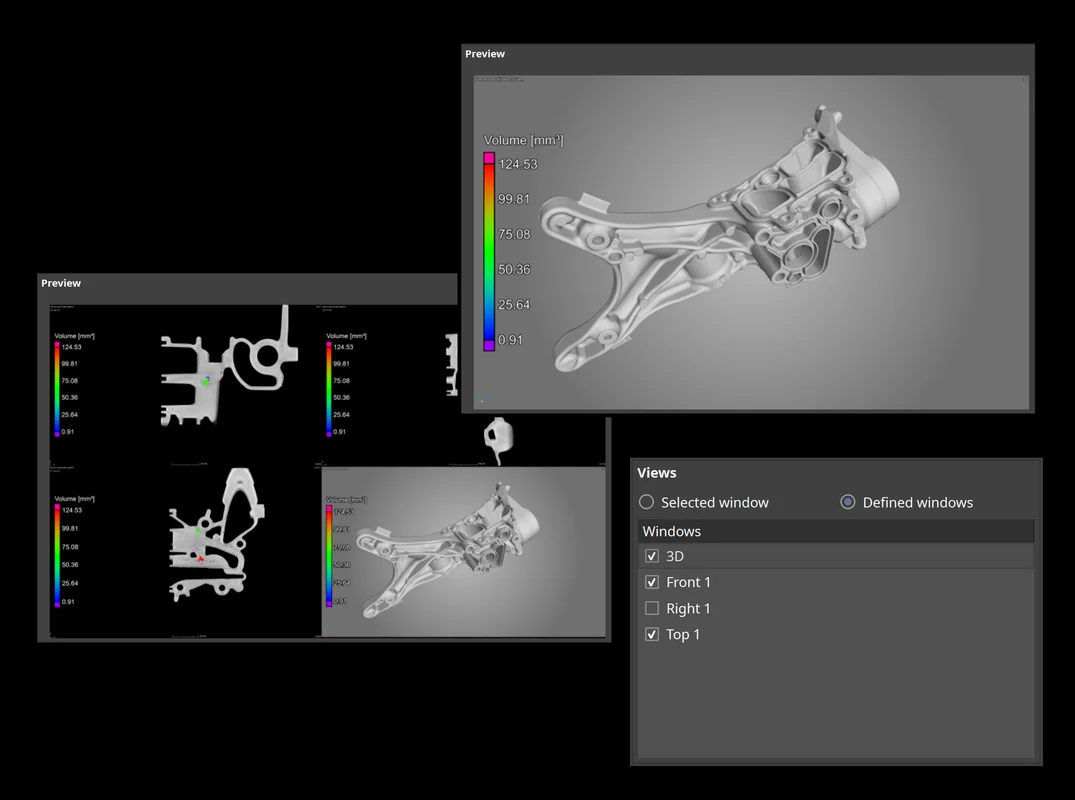
Window Options when Saving Images (New in 3.4.5)
A new save image option allows you to save either the currently selected workspace window or a manually defined combination of workspace windows. Depending on your manual inspection workflow, one or the other might be more convenient for you—the new option in the dialog allows for both while keeping the shortcut and automatic storage of other image settings unchanged.
TXM Volume Import (New in 3.4.5)
You can now directly import high-resolution volume data from ZEISS Xradia CT systems including correct settings for orientation and dimensions. Support for the TXM format, which is typically used when analyzing the microstructure of material samples, eliminates the need for a time-consuming export of DICOM or TIFF on the CT system and their manual import into VGSTUDIO MAX.
New Integrated Reporting (New in 3.4.4)
Completely new integrated reporting now lets you edit and view reports in Volume Graphics applications exactly as they will appear in the PDF, customize them, automate their creation, and store them directly in your .vgl project. The new integrated reporting function is a fast way to create presentable .pdf reports without having to switch to external software like Microsoft Excel and is available throughout our products, even in our free viewer applications myVGL and VGMETROLOGY VIEWER. And because report creation and export are macro-recordable, the new reporting is also available for automation and VGinLINE.
WYSIWYG Report Editor (New in 3.4.4)
The new WYSIWYG (What You See Is What You Get) editor as part of the completely new integrated reporting function makes it easy to create a more digestible view of your project data. You can create reports that contain all or a subset of the reportable content in the scene and customize the displayable content, such as images, table columns, or page layouts. Additionally, data sections in the report, like selected metainformation, volume information, analysis settings, or result images, can be reordered or removed altogether. Once a custom layout has been created, it can be stored and reused when similar content is to be reported.
Multi-Component CAD Models from Multi-Material Volumes (New in 3.4.4)
Convert objects made of multiple materials, such as assemblies, directly from CT data into multi-component CAD models. So when there is no digital data available, it is now possible to create CAD models of both single components and several assembled parts in their mounted position based on our multi-material surface determination.
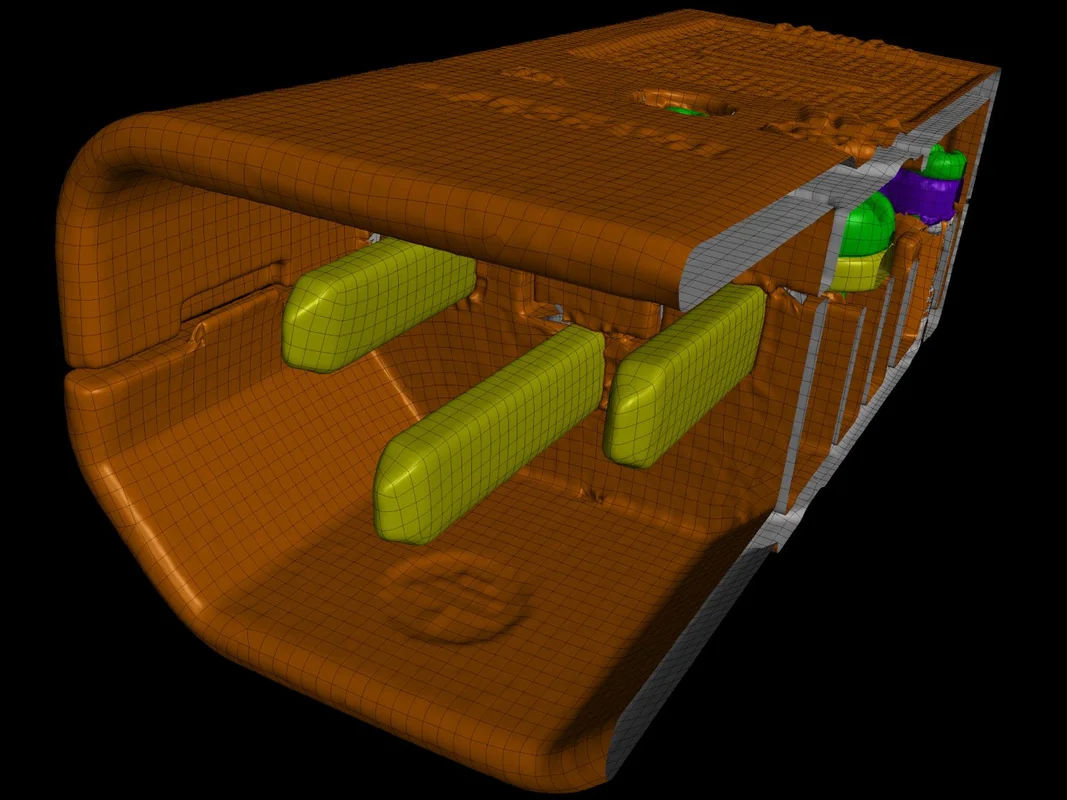
Sharp Edges in Tetrahedral Mesh Creation (New in 3.4.4)
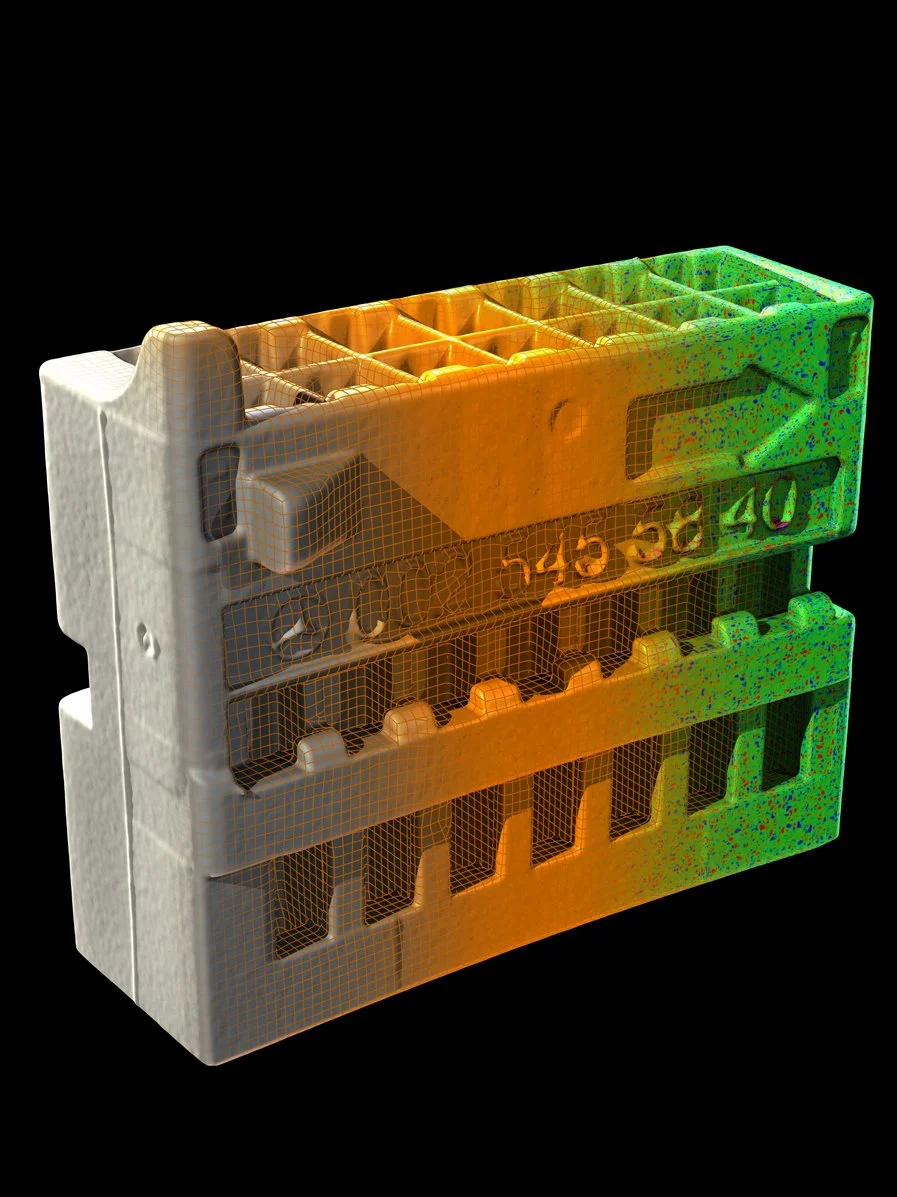
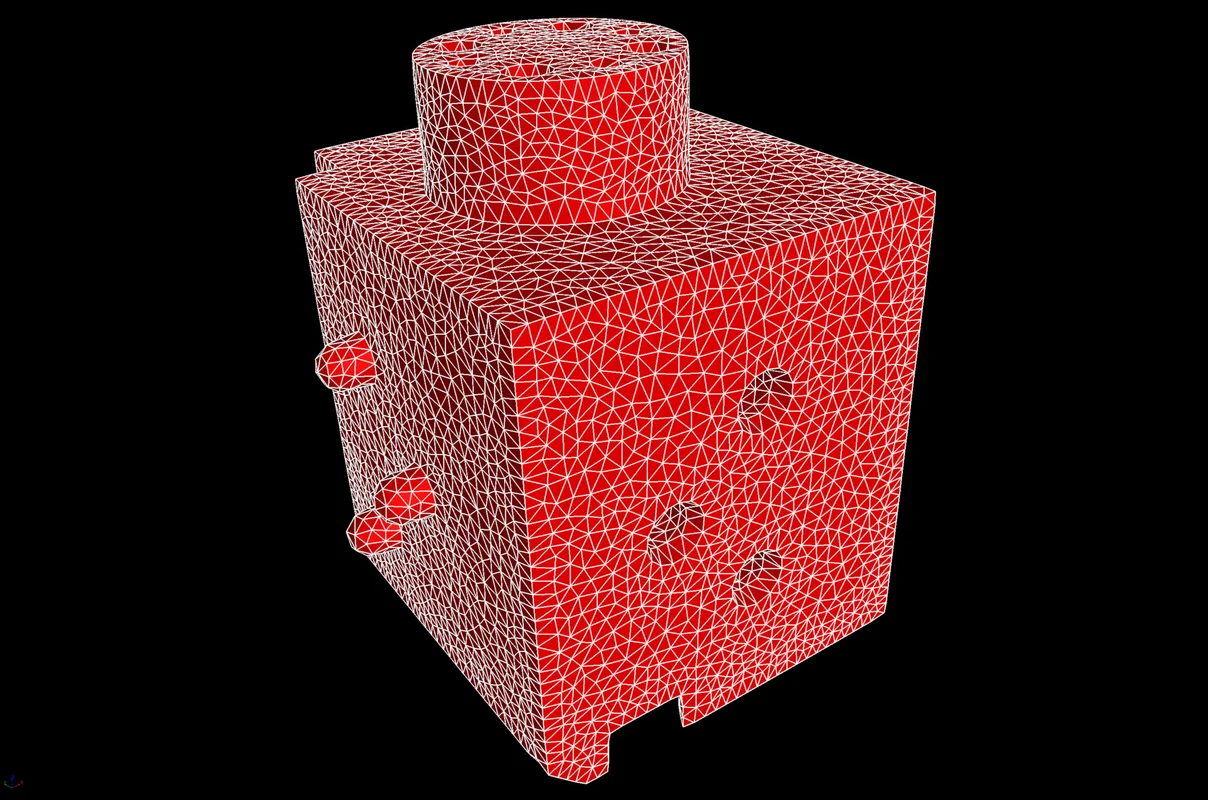
Create tetrahedral volume meshes for components that contain sharp edges to get a better representation of the component geometry with a significantly reduced number of tetrahedral elements. When activating this new option, the algorithm identifies sharp edges in the component and creates a mesh that reflects these edges by aligning FE nodes on them.
Colorize Faces along Clipping Plane (New in 3.4.4)
To give you a better overview when visually inspecting a volumetric mesh, different colors will now be used for internal and external tetrahedral element faces. When using a clipping plane, the internal faces of tetrahedral elements will be rendered in a color different yet similar to that of the element faces that constitute the outer contour of the component.


"Flip Edges" Option for Optimized Mesh Quality (New in 3.4.4)
A new powerful algorithm now lets you optimize element quality of tetrahedral volume meshes. The new "flip edges" option allows mesh nodes to reconnect differently, which will result in a significantly improved local mesh quality.
Compensation Mesh for Additive Manufacturing (New in 3.4.3)
You can now easily create a surface mesh that compensates for the difference between the actual object and a reference object—directly from the Manufacturing Geometry Correction module. This saves you time by reducing the number of iterations as opposed to a trial-and-error approach for the final printing geometry optimization. Compensate the mesh sent to a 3D printer to eliminate deviations in the nominal geometry caused by distortions. Such distortions are inherent in the 3D printing process and may even remain after a previous optimization based on a 3D printing simulation.
Define Material by Sample Area (New in 3.4.3)
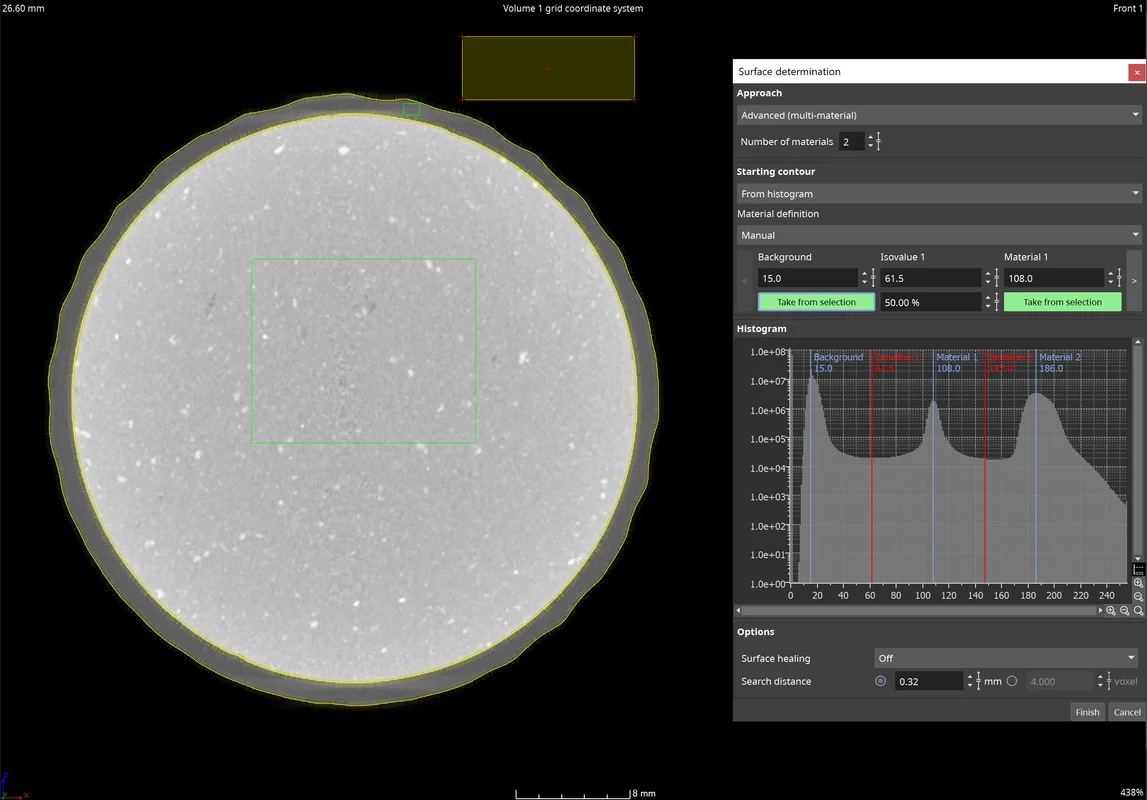
You can now directly specify regions in the 2D views from which an average gray value should be calculated by clicking the "Define by sample area" button in the "Surface determination" dialog. This is a great alternative to setting the positions in the histogram in manual mode to define background and material gray values, which makes it particularly suited for multi-material data sets. Clicking the "Define by sample area" button in the "Surface determination" dialog activates a 2D view selection that lets you specify the regions you want. You can even combine different regions via the context menu.
Manual Annotations for Geometric Tolerances (New in 3.4.3)
You can now indicate numerical deviations at certain positions on the surface in addition to visualizing the tolerance deviations via color overlays by creating annotations for geometric tolerances. The annotations are shown in the Scene Tree as well as in the new reportable annotation table in the "CM reporting" dialog. The "Features" tab in the coordinate measurement reporting is also expanded by an additional annotation table, which shows the annotations for the currently selected feature. Annotations can be created either manually at the desired positions in the views or by pasting pre-defined positions from the clipboard into the annotation table of a certain feature. The annotations can also be pasted between different geometric tolerances and are part of coordinate measurement and evaluation templates. The appearance (e.g., font or cursor sizes) can be specified in the preferences.

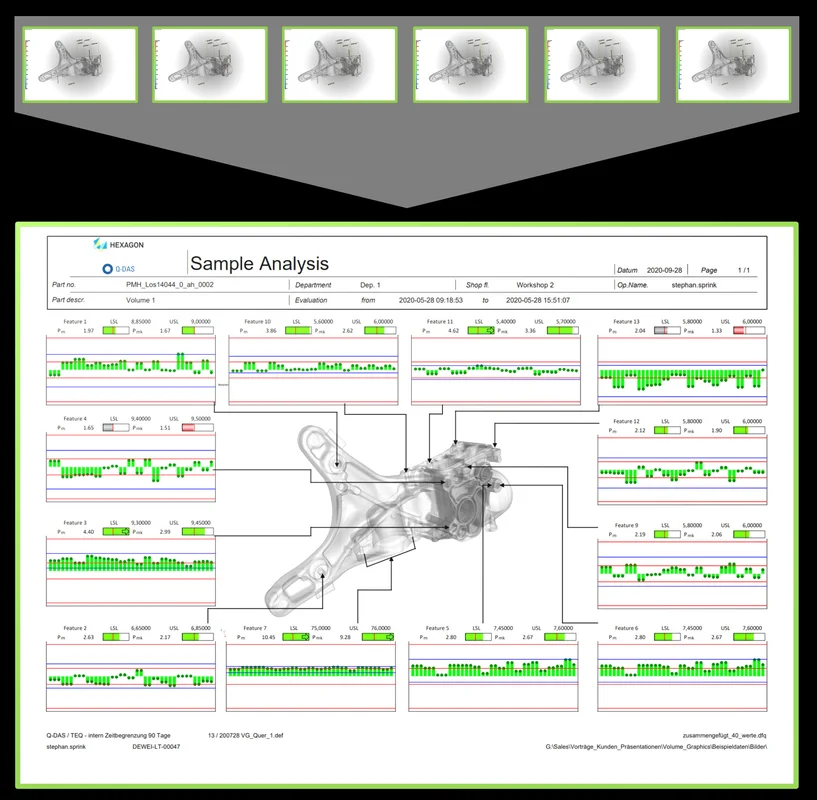
Image Support for Q-DAS Export (New in 3.4.3)
Exporting measurement results to Q-DAS software qs-STAT for statistical process control now includes associated images that indicate the position of the measured features on the part. These images can then be used to set up a report view in qs-STAT, which will be populated with the results of many measured parts. Visualizing measurement time series and the position of the measured features on the part make it easier to evaluate results, for example to locate a potential need for an injection molding tool correction during machine qualification or while production is running.
HiXCT Multiple Volume Import (New in 3.4.3)
You can now load volume data from Hitachi Industrial CT systems. The HiXCT file format, which is typical for Hitachi Industrial CT systems, optionally supports the import of volumes coming from a multi-circle scan.

Faster Access to Visualization Options (New in 3.4.3)
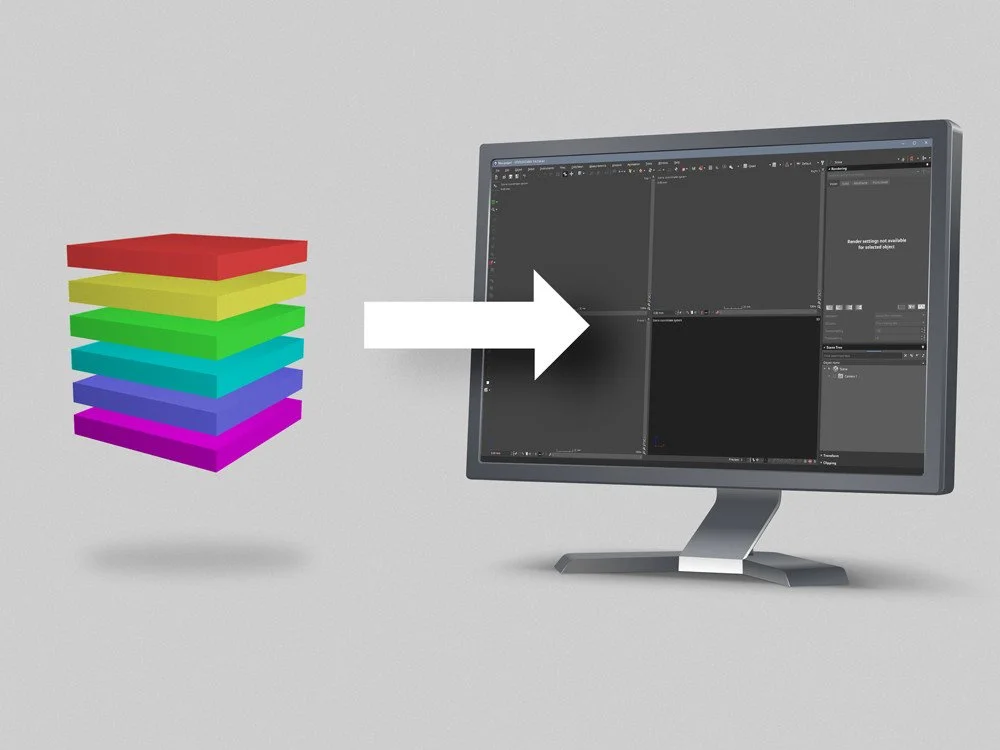
Change transparency and colors of volumes, CAD objects, and meshes faster by accessing the most frequently used visualization options in one compact icon bar.
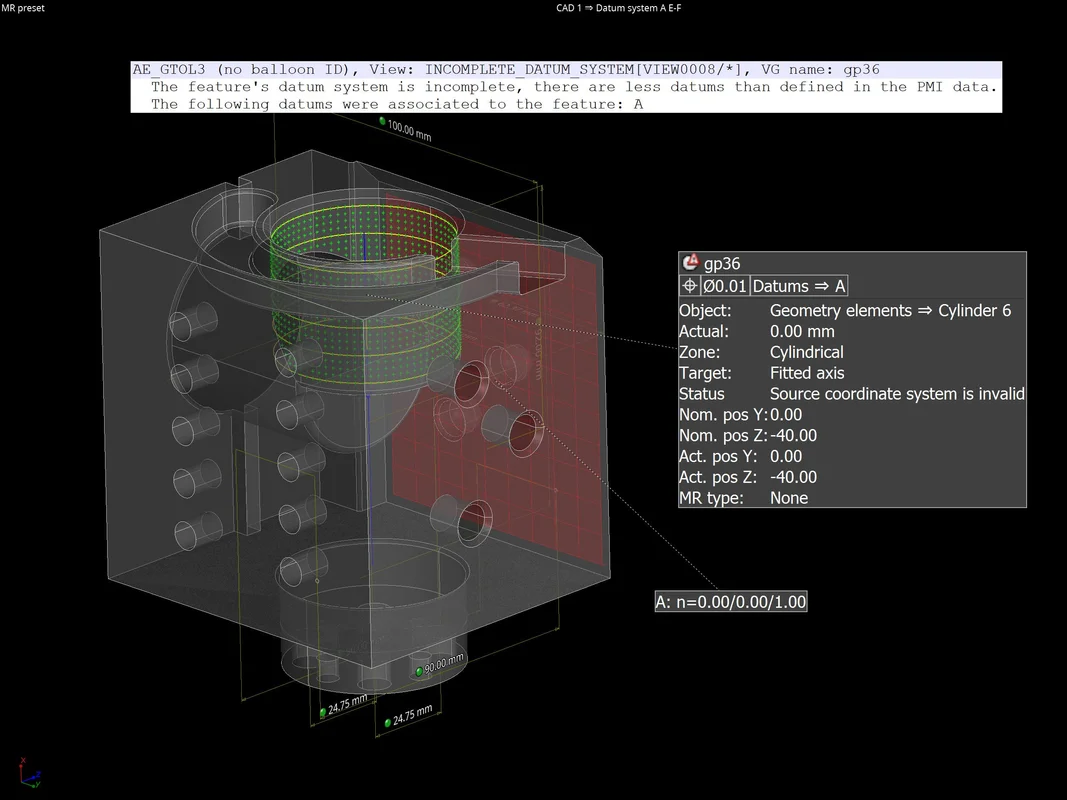
Log File for PMI Data Translation (New in 3.4.3)
The software now creates a log file to report problems that occurred in the PMI data translation step when importing advanced CAD files. Sometimes, it is not possible to translate all measurements from PMI data into a coordinate measurement template, like when data is incomplete or ambiguous. Often, these problems can be avoided in the originating CAD system by providing necessary semantic information for the PMI data. The log file now allows you to easily detect well-known problems by identifying problematic CAD entities and giving you tips on how to resolve these issues.

Intersection Points of Circle and Surface (New in 3.4.3)
Use the new intersection function on circle elements to easily detect the intersection point of a circle and the surface of a part, which is required for certain measurement tasks or alignments (e.g., on gears or other rotational structures). The maximum number of result points as well as their order can be specified. Moreover, the intersection points are also part of coordinate measurement templates, which allows them to be easily transformed and applied in a pattern.
Create ROI from Wall Thickness Range (New in 3.4.3)
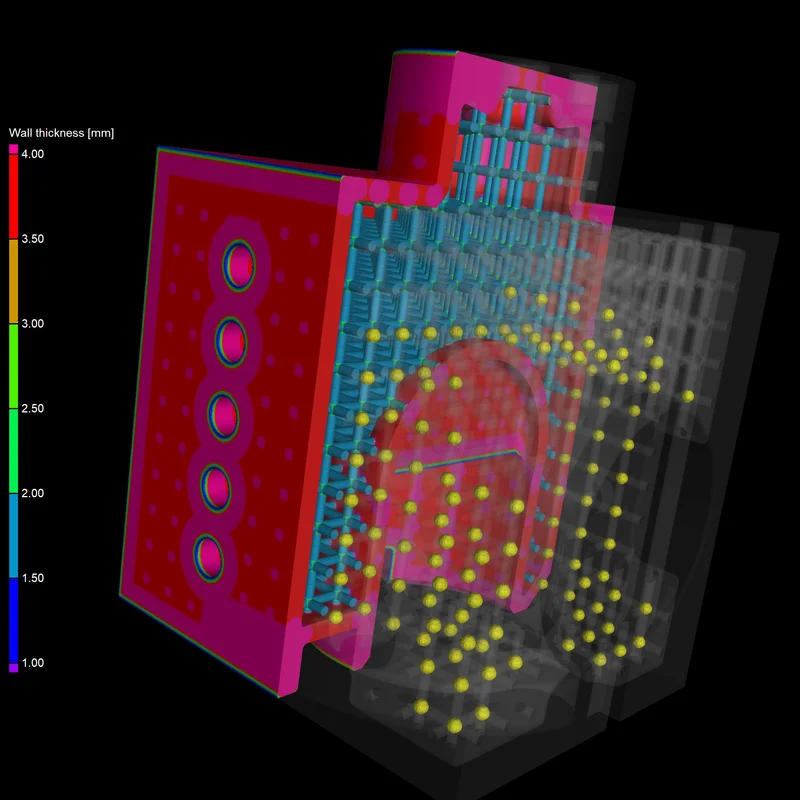
To separate thick from thin structures, you can now create a ROI from a wall thickness range. This can be very useful for when you're segmenting thin struts and thicker nodes in additively manufactured lattice structures or performing a porosity analysis to a specific region. Moreover you can use it to segment trabecular and cortical bone easily. Because separation by wall thickness is now only one click away, you no longer need to use manual segmentation tools to separate any structures with varying thicknesses.
Manual Compensation Offset for Manufacturing Geometry Correction (New in 3.4.3)
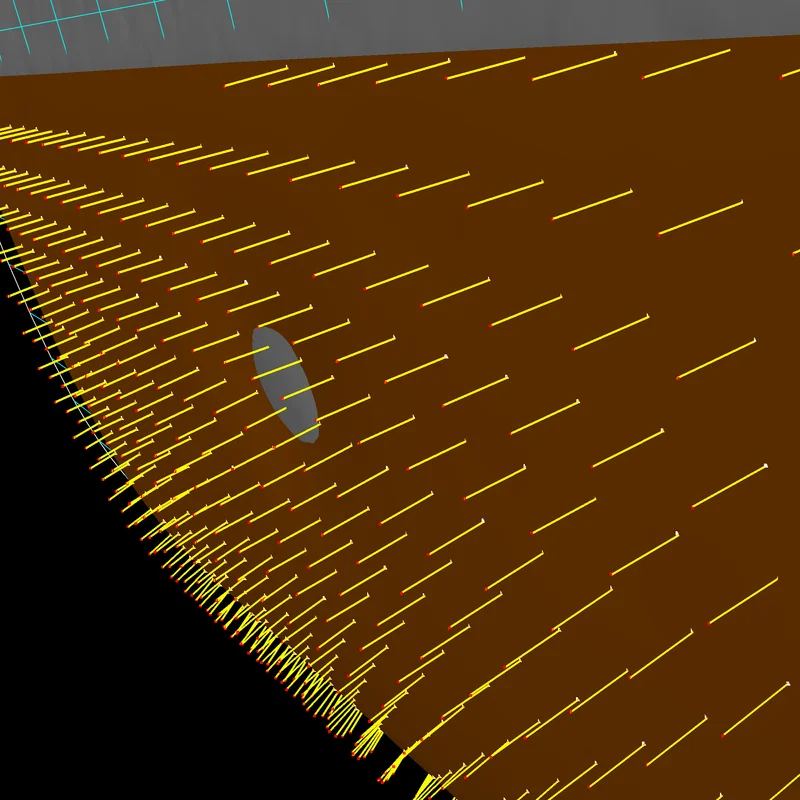
You can now approach the perfect tool (mold) shape slowly without running the risk of removing too much material. Just use the new additional manual compensation offset that's been added to the automatically calculated tool offset. This helps you easily decrease or increase the tool offset derived from the nominal/actual comparison between the part CAD model and the tool CAD model.
Visualization of Compensated Points in Manufacturing Geometry Correction (New in 3.4.3)
Visualize the compensated points as you apply deviation compensation and tool correction. This allows you to see if the sampling points were compensated correctly and if the fitted surface follows the compensated fit points well.
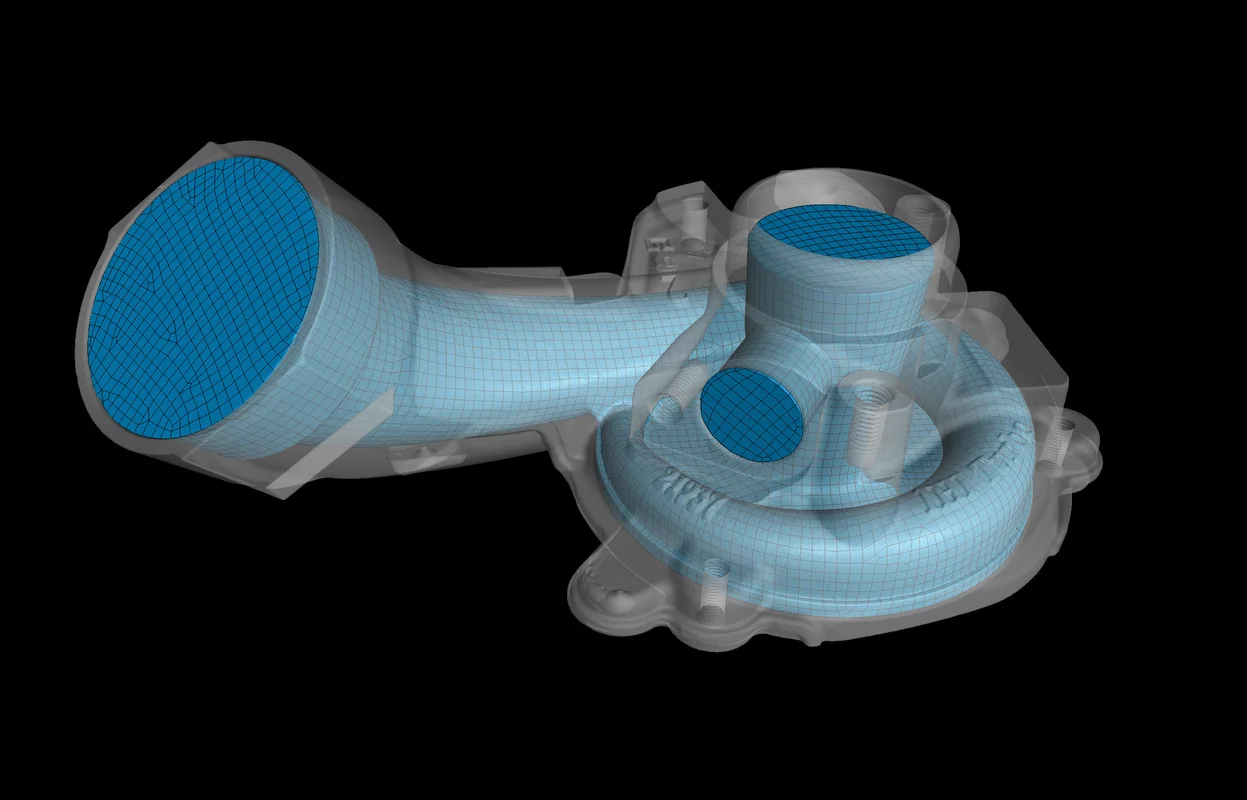
Convert ROI to CAD for Easy Reverse Engineering (New in 3.4.3)
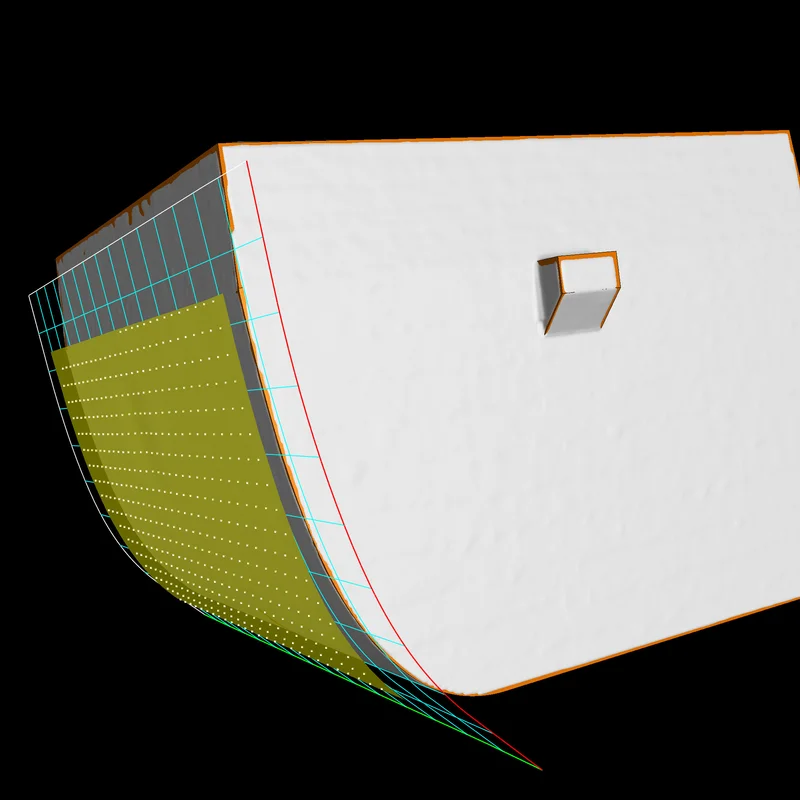
You can now convert ROIs into CAD models, which can come in handy when you want to create CADs from complicated freeform geometries—such as water cooling channels of an engine or a segment of apart. Now, these complex areas can be easily represented by ROIs.
Custom Parameters for Scan to CAD Conversion in Reverse Engineering (New in 3.4.3)
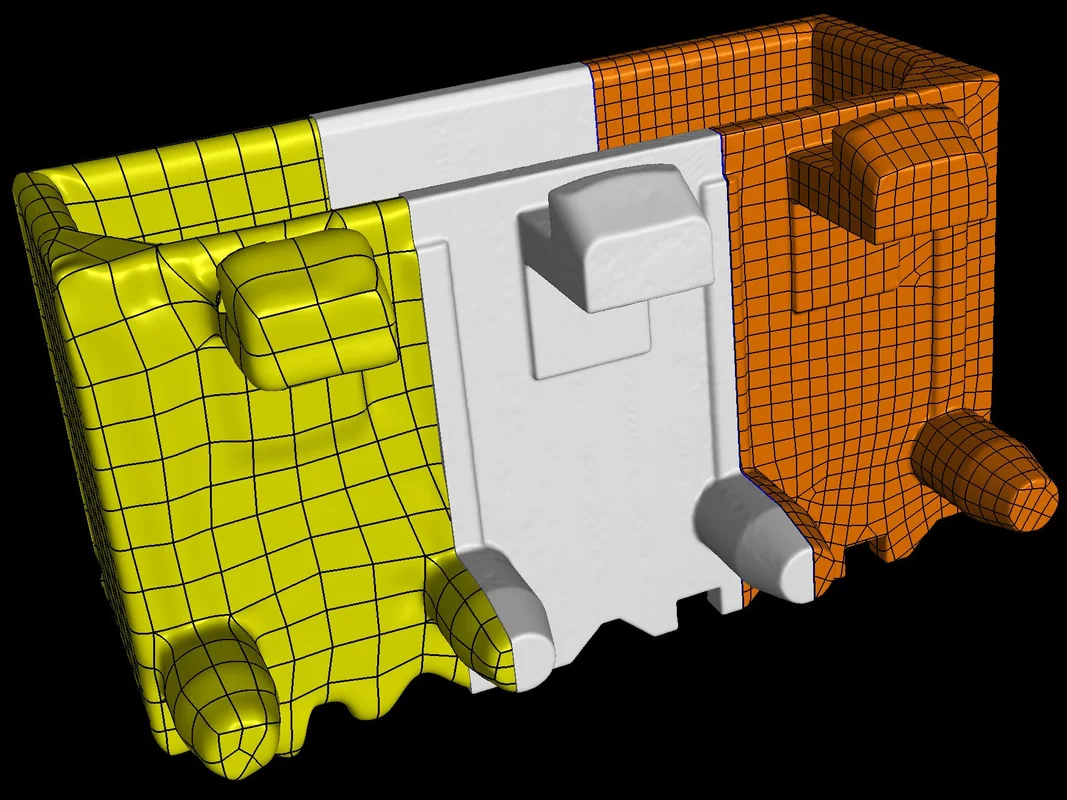
For situations where the "Low," "Medium," and "High" presets in the "Convert to CAD" dialog do not fit your needs, allow us to introduce "Manual" mode with adjustable CAD conversion parameters. By giving you the option to manually adjust quad size and number of control points, we are allowing you to convert a volume or an ROI into an optimal CAD file in terms of size, quality, and level of detail.
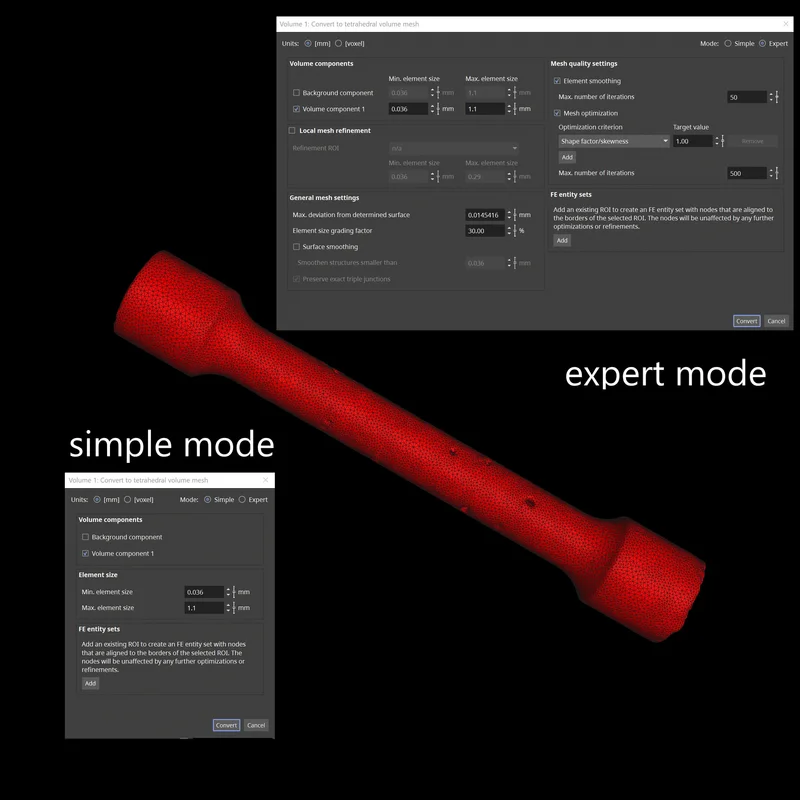
Simple and Expert Mode for Volume Meshing (New in 3.4.3)
To create high-quality tetrahedral volume meshes on CT data more easily, we've split the user interface for volume meshing into "Simple" mode for defining basic mesh properties and "Expert" mode for defining more advanced meshing options. "Simple" mode enables you to quickly and easily define the main settings resulting in high-quality meshes for typical meshing tasks. "Expert" mode can be used to control advanced settings to further improve mesh quality if needed.
Protected Intersections of Multiple ROI Outlines in Volume Meshing (New in 3.4.3)
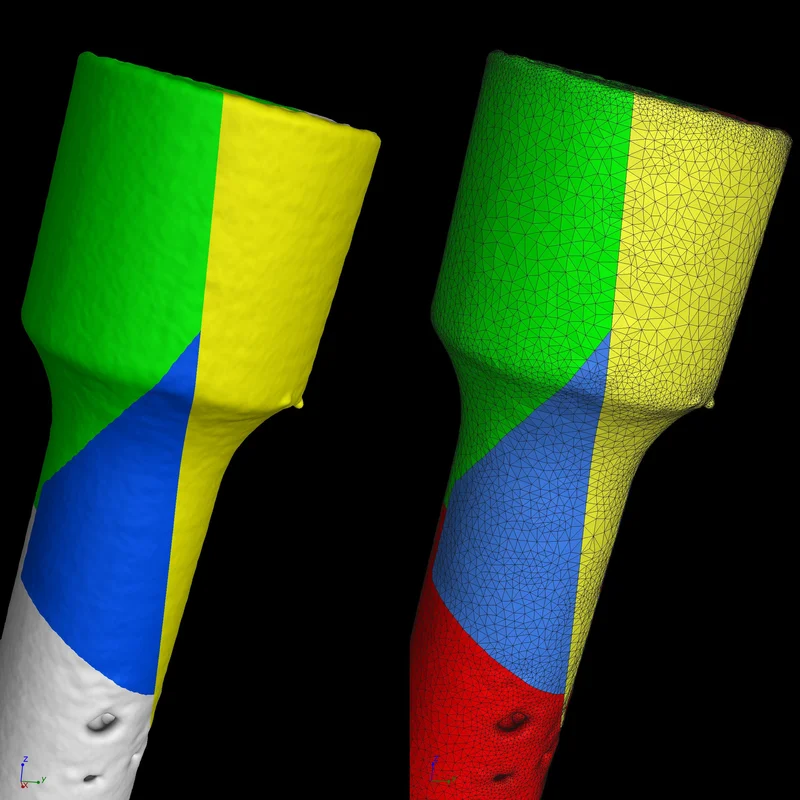
The intersections of multiple ROI outlines are now protected when FE entity sets respecting ROI outlines are created. This improves geometrical definition accuracy of the FE entity sets following multiple ROI outlines.
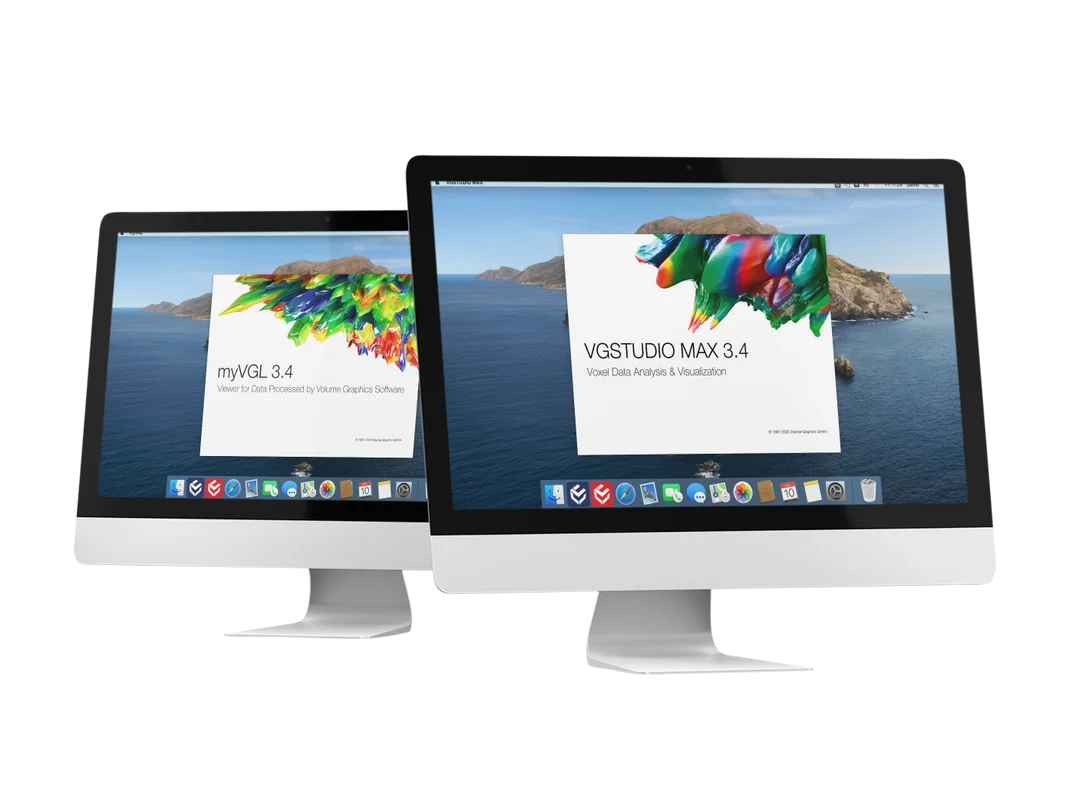
VGSTUDIO MAX and myVGL for macOS (New in 3.4.1)
With version 3.4.1, we offer VGSTUDIO MAX and myVGL for macOS again (macOS 10.15 Catalina or macOS 10.14 Mojave). A graphical user interface optimized for the high pixel density of the Mac's Retina display makes working with VGSTUDIO MAX and myVGL on the Mac all the more enjoyable. Also, VGSTUDIO MAX 3.4.1 is the most comprehensive version for macOS yet, offering the array of possibilities introduced with VGSTUDIO MAX 3.4.0 to our Mac users.*
Reverse Engineering
With its auto surface function, the new Reverse Engineering Module makes it easy to convert CT scans into CAD models that you can use in your CAD systems.
You can use these CAD models for products that don’t have existing 3D representation—cost-effectively and directly from CT or mesh data—to make manually generated design models available digitally, generate CAD models for old parts where no CAD information (or only 2D drawings) is available, update models in which the actual part or tool looks different than its master CAD model, and enable CAM systems to mill on CAD instead of meshes. All in one software, and without the need for a CAD designer or reverse engineering specialist.
The Reverse Engineering Module creates a pattern of 4-sided patches that follows the edges and main features of the model. By including these character lines, the result is a useful patch layout of untrimmed NURBS surfaces—commonly known as an auto surface model—which can be exported as a STEP file to any CAD system.
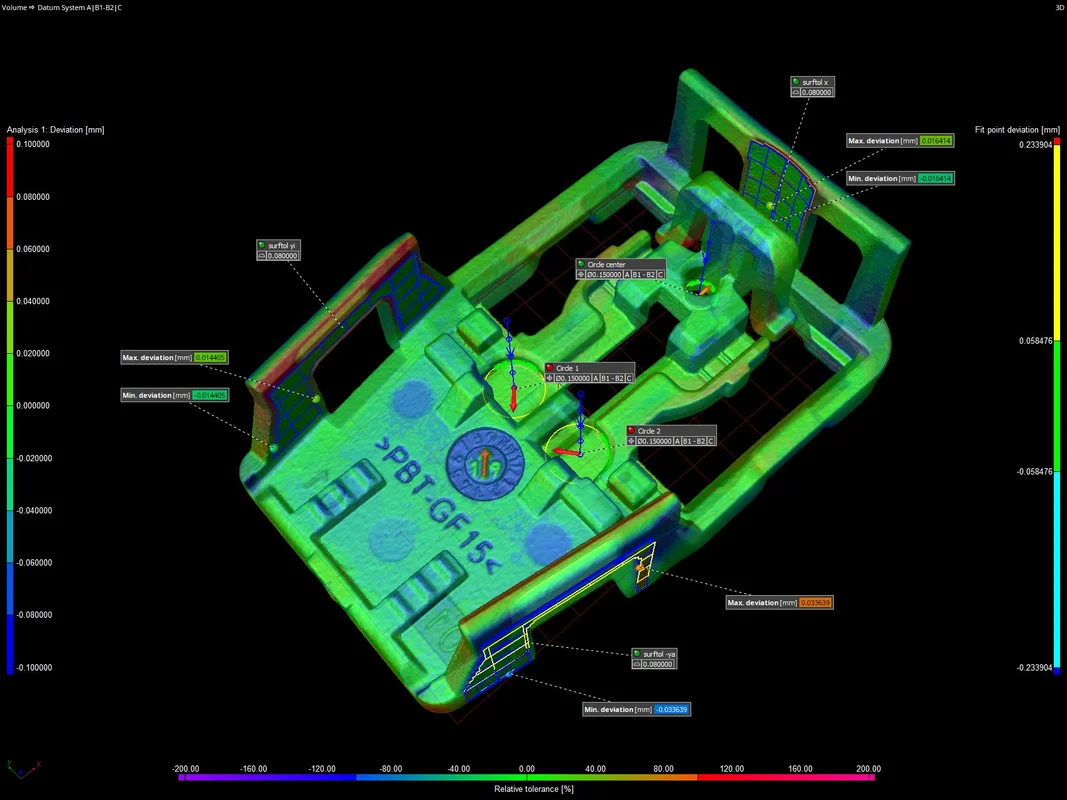
New Visualization Option for Deviations of Geometric Tolerances
A new visualization option gives answers to questions such as: Where exactly are the highest deviations located? How are the deviations distributed on a surface? Which areas of the surface were actually evaluated? Where do the pattern deviations come from? This option is helpful when a pure OK/NOK decision is not sufficient and additional information is required for various reasons (e.g., to adjust manufacturing processes or to decide if a deviation is critical).
Depending on the toleranced element, certain methods for visualizing the actual deviations can be activated, e.g., a colored and scaled deviation vector for position tolerances, while simultaneously visualizing entire patterns of position tolerances. Combined with the possibilities of bookmarks, this allows for a visual, comprehensible, and easily understandable communication of a part’s geometrical deviations.
Subvoxel-Accurate Defect Detection with VGEasyPore
You can now capture the shape of defects with subvoxel accuracy using the new subvoxel-accurate mode of VGEasyPore. This makes it possible to differentiate between gas pores and shrinkage cavities based on the sphericity and compactness of defects. The ability to acquire a more exact shape of given defects also allows you to make better predictions about potential component malfunctions caused by these defects.
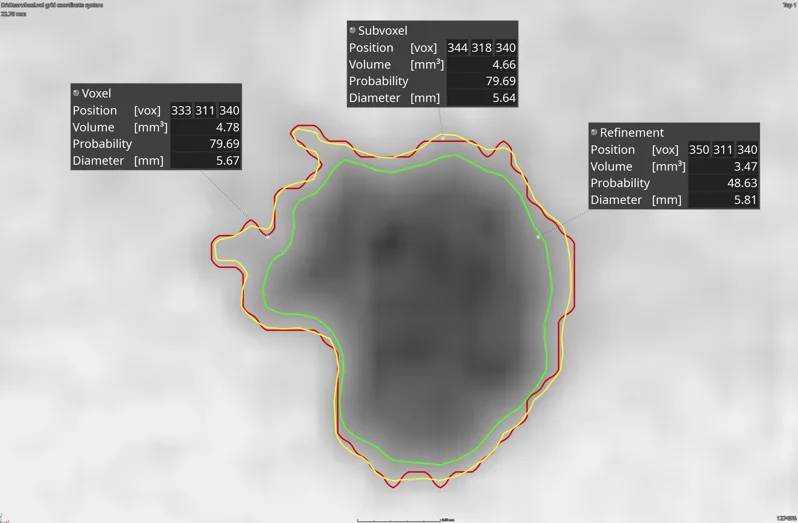

Contour Rendering of Defects
With the new "Render outline only" function, a detected defect is not flooded with a color that indicates the chosen property of this defect; instead, only the surface of the defect is displayed in the same color. This allows you to quickly decide if the real size of the defect was segmented by the defect detection using the chosen settings. In data sets with a high number of artifacts (e.g., scatter, beam hardening, noise, and sampling artifacts), defects can sometimes be labeled as too large and thus lead to an unnecessarily high rejection rate, as the defect size is outside the defined tolerance. If you want to correctly segment all defects in this type of data set, contour rendering, which is available for all defect detection algorithms, will help tremendously.
Digital Volume Correlation Module
The new Digital Volume Correlation Module allows you to quantify displacements between an initial and deformed volume in a simple and intuitive way. In material science, this is an excellent tool for quantifying strain and displacements of the visible inner structure of composite materials, foams, or porous components produced by additive manufacturing.
The Digital Volume Correlation Module offers superior support for finding damage in materials using a voxel-based before-after comparison, making it possible to easily export strain tensors with respect to your FEM mesh to validate your FEM simulations. It allows for the convenient alignment of the initial and the deformed volume through the use of VGSTUDIO MAX built-in registration tools and the subvoxel-accurate determination of displacements and strain fields.
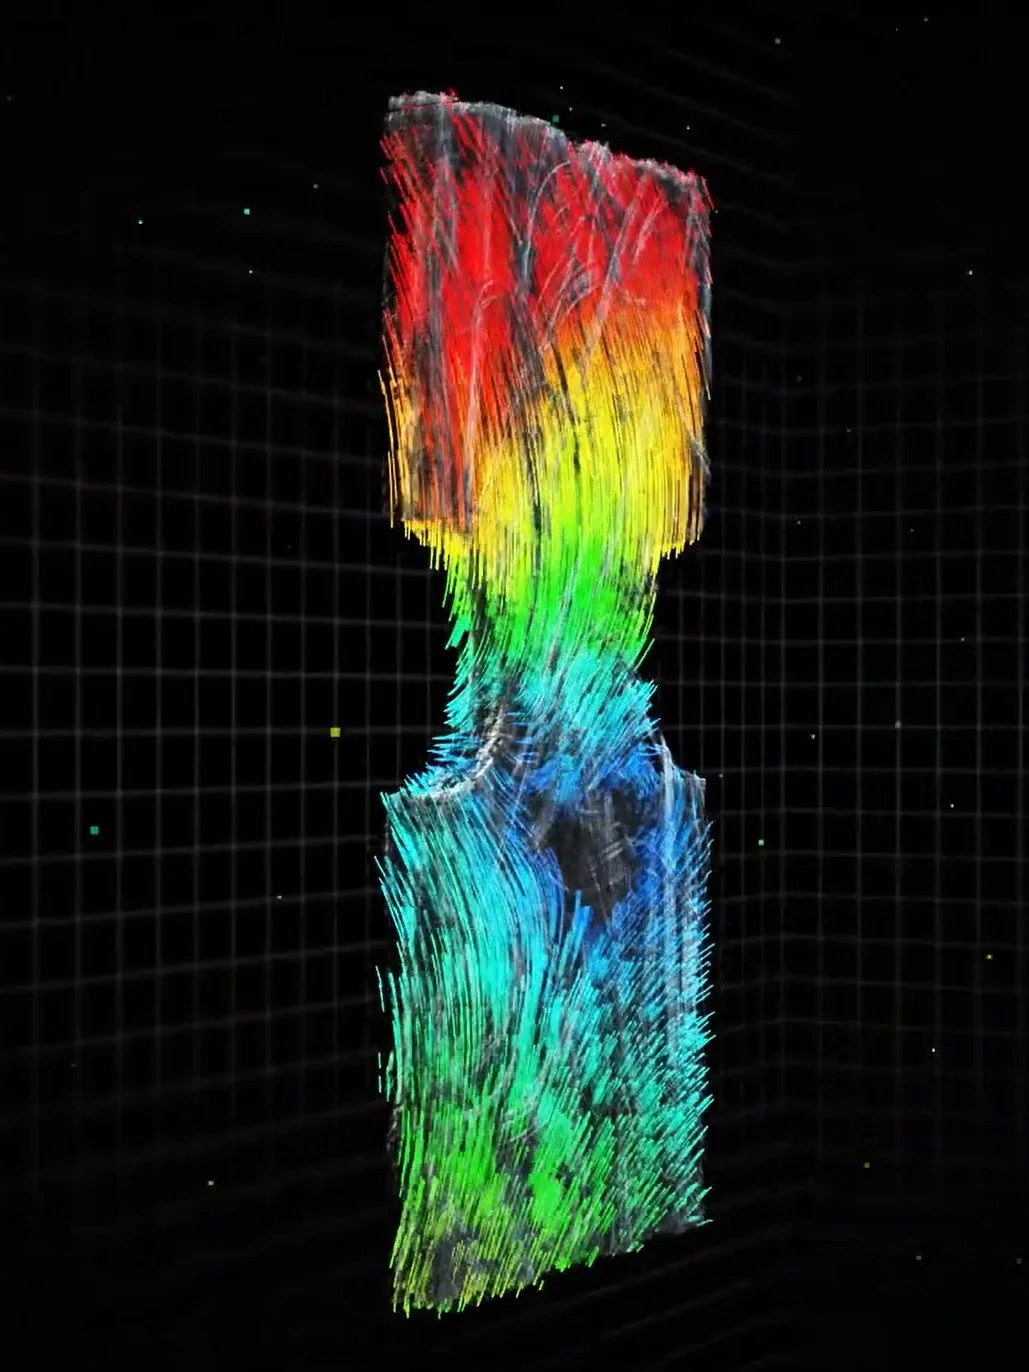
Results—such as deformations—can be impressively visualized by using vector fields and strain lines. The equivalent strain or single components of the strain tensor can be shown as a color overlay and mapped directly on a volume mesh to validate the results of your FEM simulations. These meshes can either be imported from other programs, e.g., Patran (.pat) or Abaqus (.inp), or generated using the Volume Meshing Module. The Digital Volume Correlation Module also assists you in detecting arising singularities, like cracks and pores that can hardly be seen with the naked eye, by comparing the initial and the deformed image.
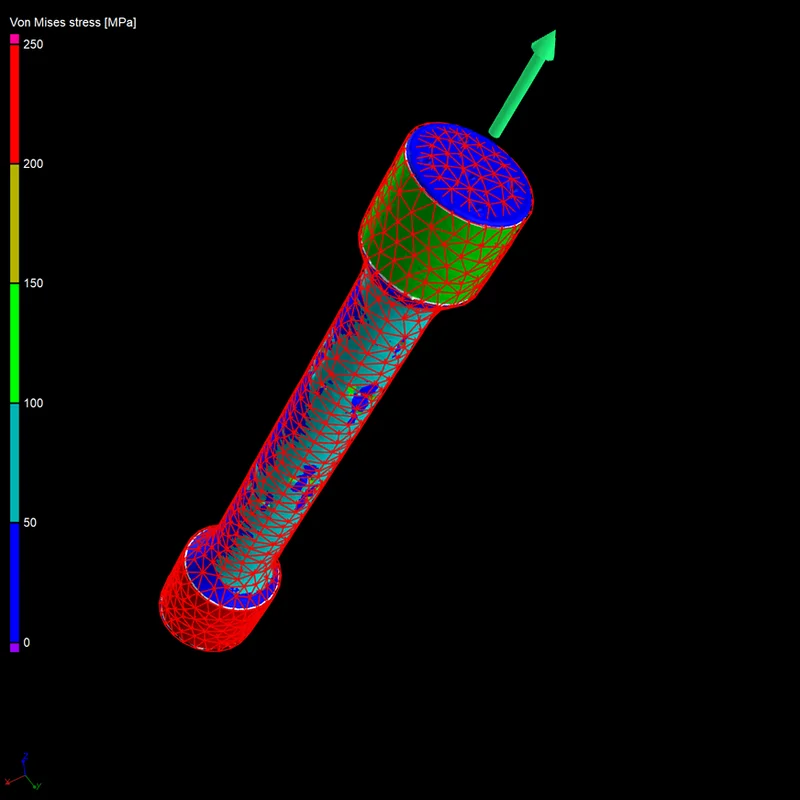
Stress Tensor Export
You can now use a stress field calculated using the VGSTUDIO MAX Structural Mechanics Simulation Module as input in third-party simulation software, e.g., for fatigue analysis, by mapping the stress tensor components onto a volume mesh and exporting them in a .csv format. For each integration mesh cell, the stress tensor components related to the maximum scalar value chosen by the user (maximum von Mises stress, maximum shear stress, or maximum principle stress within the integration mesh cell) will be exported.
This new export function in the Structural Mechanics Simulation Module allows you to take advantage of a detailed micromechanical simulation on real components for a more realistic and precise assessment of a component's structural performance within your existing simulation workflow.
Exact Angle Reconstruction for Circular Trajectories
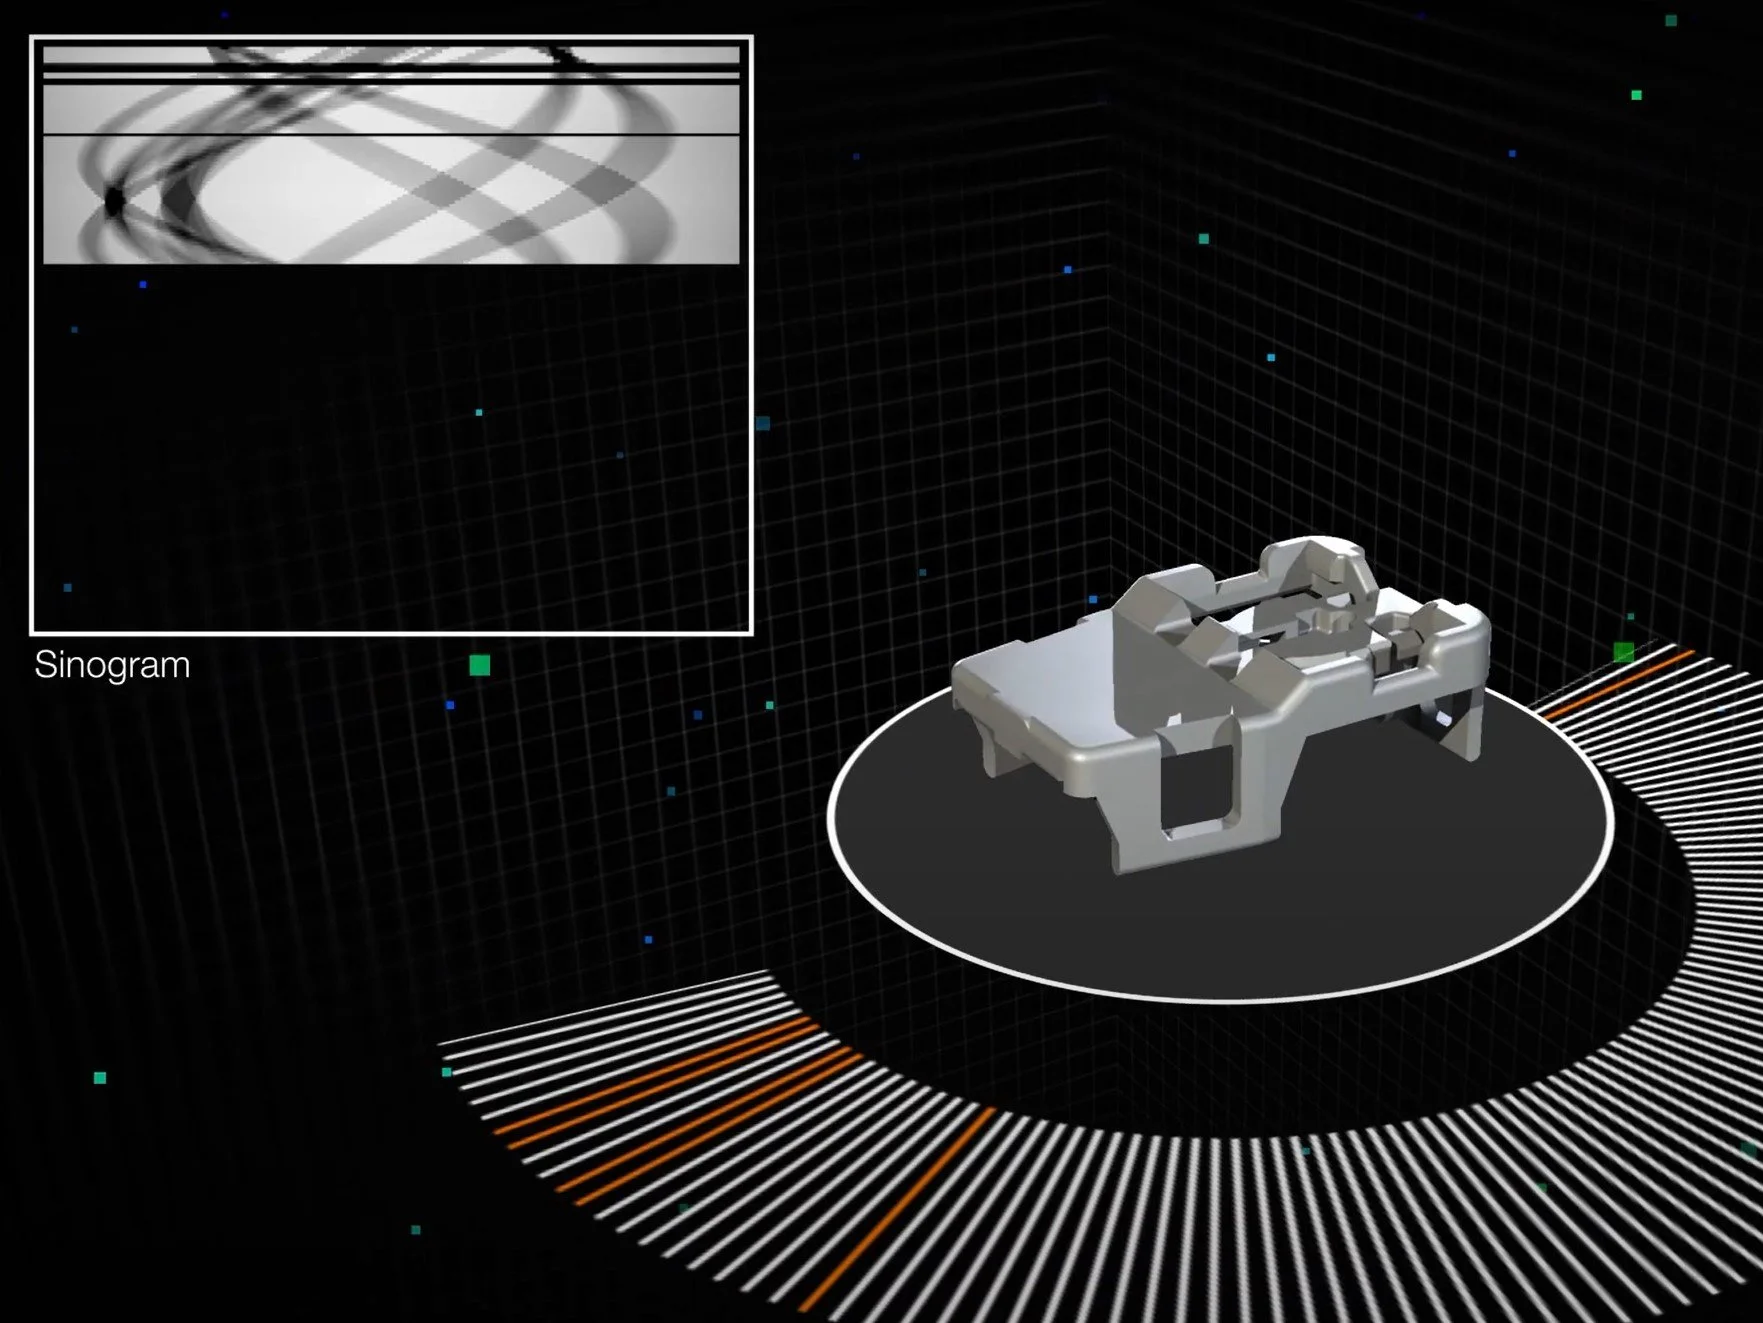
You can now factor in the real angular position of each projection for a high-quality reconstruction. If your CT system is equipped with an angular encoder that provides the actual angular position of each projection, you can now use this information to increase the spatial resolution of your scan—or if some projections went missing during your CT scan, you can now skip these projections and still get a high-quality reconstruction without artifacts from missing or incomplete projections and without having to perform re-scans.
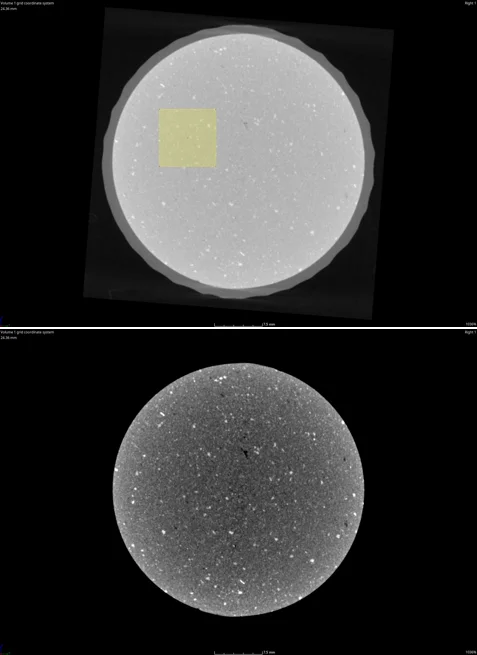
Auto-Adjusting Opacity Curve
You can now save time by using the new, automatically adjusting opacity curve. Based on a rectangle drawn in a 2D view of one object, the contrast for the selected region will automatically be optimized. With one click, the contrast can be converted to an opacity curve that provides the optimal contrast for the selected region. You can also apply this to several objects in the scene to compare the selected region between two or more scans.
This is helpful for the visual inspection of an area of interest or the same area of interest for two or more objects.
New Tool Dock
The new, more intuitive Tool Dock reduces the mouse travel needed to navigate to the next tool. It now has fewer—but more intuitive—icons. Tools can be expanded and collapsed or pinned; by only expanding the currently used tool and automatically collapsing the others, you will eliminate the need for vertical scrolling. Tools that you want to have permanently visible (e.g., the Scene Tree) can be pinned. For the best visibility, expanded tools will always use all the available vertical screen space.
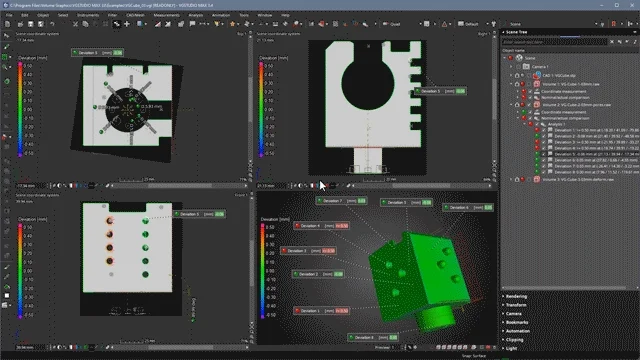
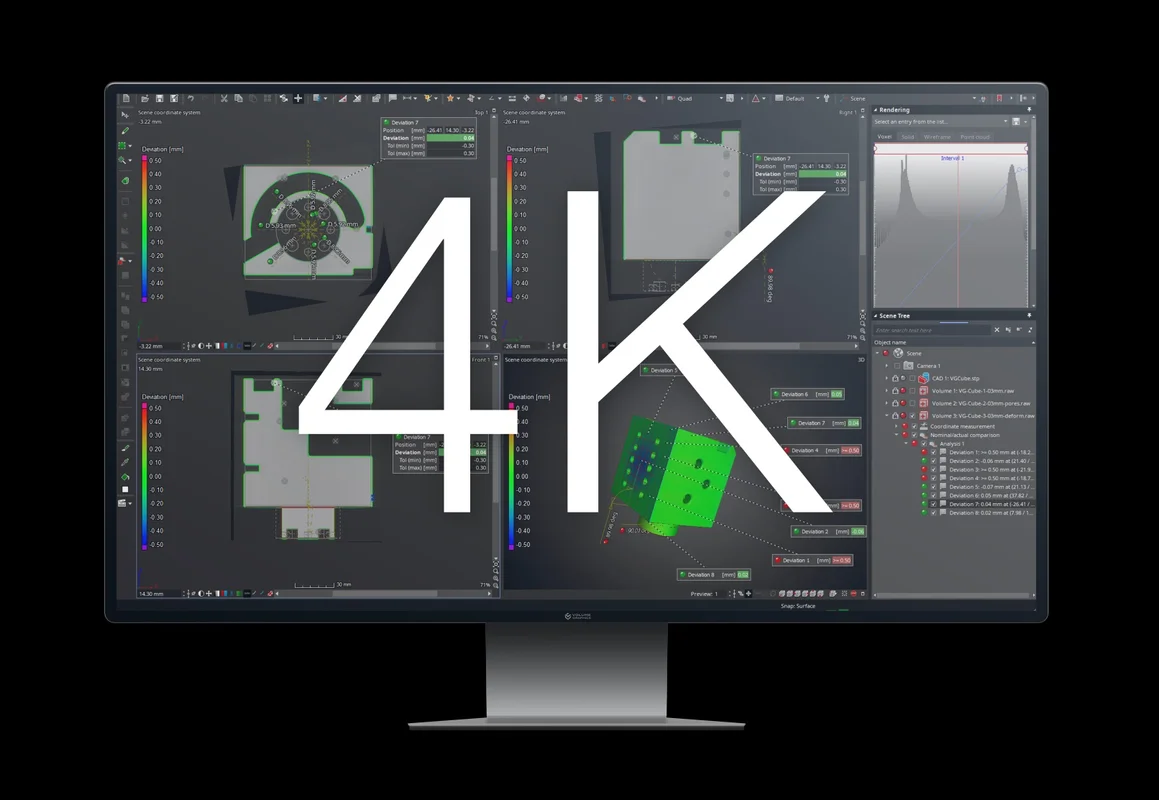
Support of 4K Displays
Enjoy a crisper, sharper, and scalable graphical user interface of all applications on 4K displays.
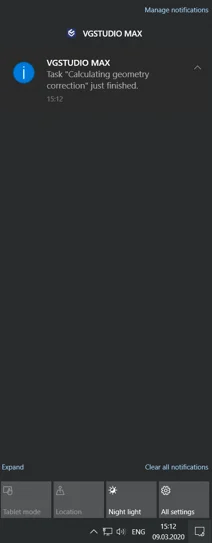
Operating System Notifications
When running other applications parallel to Volume Graphics software, you will now receive a notification when calculations or other processes in the Volume Graphics applications are finished. This allows you to work simultaneously on other tasks without missing important developments in Volume Graphics applications.
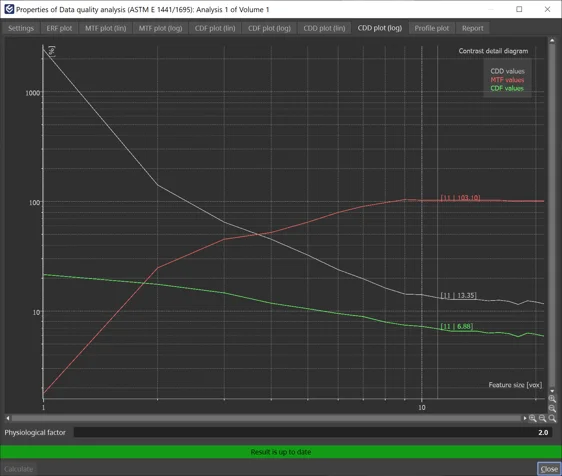
Contrast Detail Diagram According to ASTM E 1441
You can now monitor the state of your CT system over time by calculating the Contrast Detail Diagram (CDD), which combines structural and contrast resolution in one measurement according to ASTM E 1441. This parameter estimates the minimum contrast that a feature of a given size must have in order to be detectable. The new measure is supported in addition to the MTF (Modulation Transfer Function) and CDF (Contrast Discrimination Function).
Faster Multi-Material Surface Determination
The calculation time of multi-material surface determinations is now almost twice as fast (depending on your system configuration), as it utilizes the graphics processing unit (GPU) of your computer. With the option of using the GPU for time-consuming advanced surface determinations in multi-material data sets, you will experience fewer disruptions in your manual workflows and a smoother inline operation.
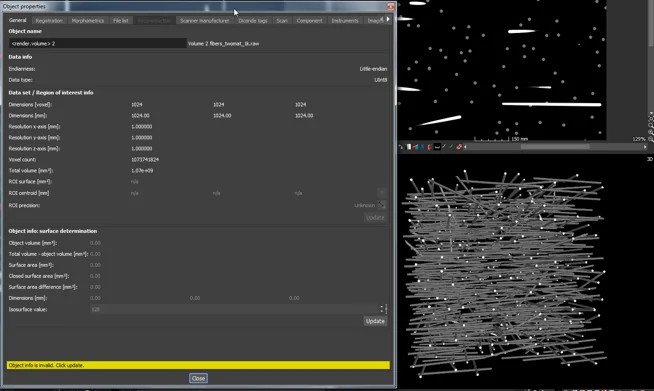

Preview in Coordinate System Editor
A new preview option in the coordinate system editor allows you to interactively see changes in the views while you create or modify a system. For example, with the preview option, it is no longer difficult to select the correct axis labels and orientations when creating a new coordinate system (e.g., 3-2-1 or datum system).
Helix Pattern in Coordinate Measurement Templates
Coordinate Measurement Templates now support helix patterns, which allow you to more quickly measure parts with re-occurring geometries along a helical path (e.g., threads and gears).

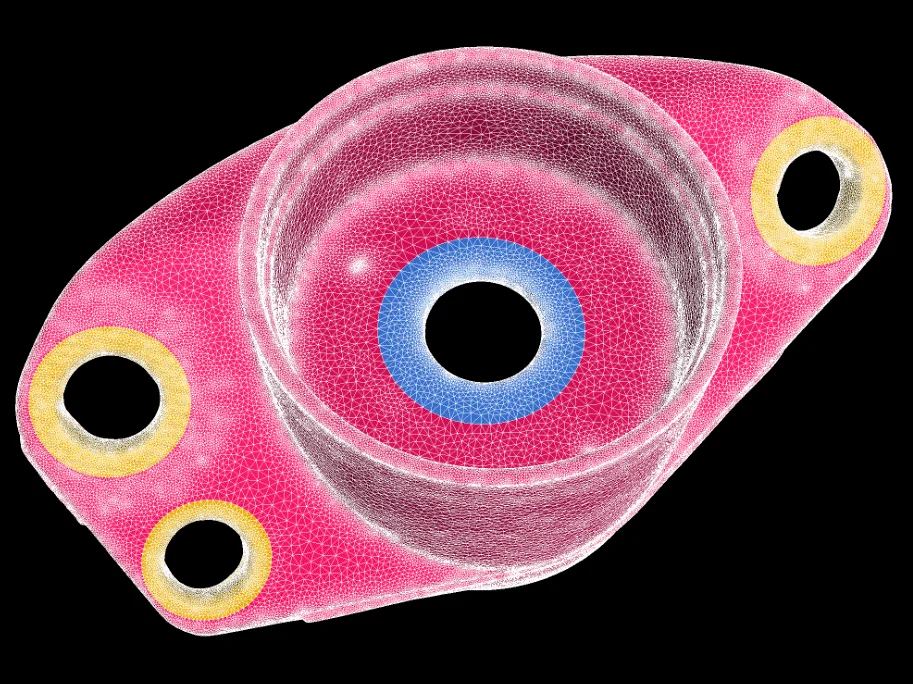
Finite Element Entity Sets Follow ROI Outline
You can now create finite element (FE) entity sets for facets and nodes based on ROIs with element nodes that are aligned to the borders of the defined ROI. Since the intended FE entity set contour will be created following the underlying ROI outline, you can create very accurate, geometrically well-defined FE entity sets to create boundary conditions in third-party FEM software. The contour of the created FE entity set is independent of the chosen element size and other meshing parameters. It enables mesh quality optimization and purging, making FE entity set definition efficient, reliable, and robust.
Color Overlay for Finite Element Entity Sets
FE entity sets can now be visualized with a color overlay. The new visualization function adds comfort and control when defining FE entity sets to create boundary conditions in third-party FEM software. It enables the visual inspection of the created FE entity set before export and thus minimizes the need to switch between VGSTUDIO MAX and FEM preprocessors, allowing you to perform the complete workflow (creation, visual inspection, correction, and export) in VGSTUDIO MAX.


Visualization of Unconnected Element Sets
It is now easier to remove scanned and meshed non-structural content, e.g., dust or loose particles, from a created volume mesh. A new visualization feature enables you to review the identified, unconnected element sets of an FE mesh in a different color before purging them, which enhances your control over the final mesh.
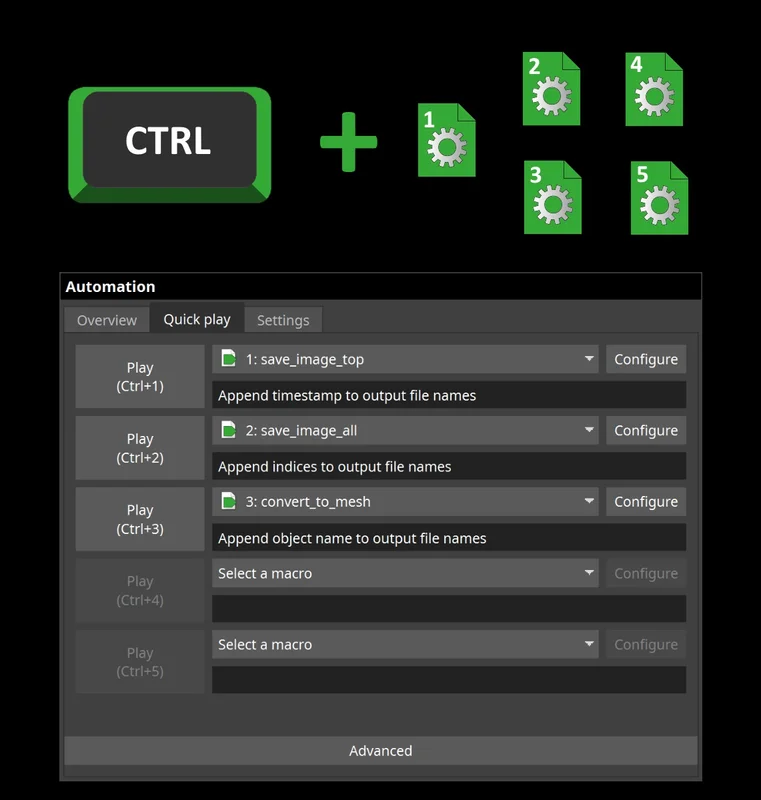
Quick Play for Macros
You can now save time by quickly triggering freely configurable macros that contain arbitrary functions via predefined shortcuts, including the handling of file outputs. Quick play for macros allows you to easily automate and execute repeating steps in an otherwise manual workflow.
Convenient Review of Meshes and Toggling between Settings (New in 3.4.3)
We've made the workflow to inspect and compare tetrahedral meshes more convenient:
- While having the mesh properties dialog open, you can now visually review the created mesh by performing actions (rotating the component, zooming in, scrolling) in the 2D or 3D windows.
- Also, you are now able to toggle between volume meshes generated using different settings and compare the mesh quality results in the histograms directly without having to open and close the dialog each time.
Extended Import of ABAQUS .inp Files as Integration Mesh (New in 3.4.3)
Now, ABAQUS meshes including hexahedral elements in addition to tetrahedra elements are supported when importing .inp files as integration meshes. By broadening the interface for the import of the ABAQUS .inp format, we enable you to map results of various analyses in VGSTUDIO MAX onto ABAQUS FE meshes. Thus you can enrich FE simulations with micromechanical information in software packages that support .inp files.
File I/O
- We've improved import performance when loading image stacks from a local hard disk and eliminated the need to manually alter the number of CPU threads for image stack import. (New in 3.4.3)
- Import multiple CAD models, meshes, or .vgl volumes from one storage location in one go: Just open the "Quick import" dialog from the "File" menu, the icon bar, or via "Ctrl + I" and import one or multiple objects at once. (New in 3.4.3)
- Improved support for new NSI file format (.nsihdr): If the necessary converter application is missing, you will now get an informative error message. Also, the "Pack and go" function now works as expected with the new format. (New in 3.4.3)
- The quick file integrity check function protects your .vgl projects from loading incorrect reference volume data. It offers an equal level of security compared to the full check while reducing the demand on hardware resources, like CPU usage and network traffic.
Reconstruction
- By importing JSON files, which are based on an open, non-manufacturer-specific standard, you can now use actual angular positions, unlike with manufacturer-specific formats like .hdr. (New in 3.4.3)
- To help CT manufacturers to generate a CT geometry parameter file (like .pca, .act, or .hdr), which includes the necessary geometric information to perform a reconstruction using the GUI, we've added documentation of the VG JSON parameter file for CBCT geometry. (New in 3.4.3)
Visualization and Navigation
- Faster creation and replacement of bookmarks, resulting in performance that is nearly 10x faster in complex projects that have, for example, a large number of coordinate measurement objects.
- Preference options for changing the appearance of the indicator in all views, allowing you to adjust size and shape (e.g., circle) of the indicator and thereby ensuring that the indicator itself is not covering what you actually want to show.
- Import and export of an application layout to store an existing icon bar and tool dock configuration for re-use on a different computer or sharing with colleagues. This allows for easier standardization of application layouts for different workflows, across computers and company sites.
Surface Determination
- Faster preview and calculation of the (classical) advanced surface determination when using surface healing to remove voids or particles from the initial surface determination.
Geometry Elements
- Improved refitting and accuracy for profile tolerances: When profile tolerances need to be evaluated on complex shapes, it may be difficult to specify a measurement template that can be applied to several different objects. But now, freeform surfaces created on CAD faces are watertight on common edges and can be refitted more reliably due to the ability to specify a number of iterations for the refitting process, which also improves the accuracy of profile tolerances.
- You can automatically adjust the size of geometry elements on the actual object: Until now, geometry elements have kept their original size (from the time they were created), even when they are applied to a different object, which requires the user to manually trigger a size adjustment (e.g., to the resulting fit points). Now, the user has the option to automatically refit the size on the actual object for fitted geometry elements. Combined elements (e.g., symmetry) will always adjust their size immediately according to their source elements.
- Option to change the storage system for several geometry elements at once: In earlier versions, the adjustment of the storage system of a geometry element could only be done by editing each individual element, making it time-consuming to adjust measurement plans. Now, an additional column on the geometry element tab of the CM report shows the storage systems of all geometry elements and allows you to select several geometry elements at once and change their storage system.
Coordinate Systems
- User-defined axes in datum systems: You can now specify the axes labels and orientations during the creation of a datum system in the coordinate system editor, allowing you to create a datum alignment where the views mirror those in your drawing or CAD system.
Alignment
- Align objects by local coordinate systems: You can now easily align two different objects (e.g., the nominal CAD model and the actual volume) relative to each other according to a certain alignment method, e.g., 3-2-1 or datum, by simply selecting both local coordinate systems and using the "Apply transformation" function without needing to change the alignment of the nominal object.
Dimensional Metrology
- Apply a default column layout in tables directly from the context menu: Most tables in the application now allow you to store and apply a certain column layout, making it easy to unify the order and layout of the table columns across different projects. (New in 3.4.3)
- Improved handling for the creation of features and geometry elements: You now have more options (e.g., to clear the fit points) in the context menus of the 2D and 3D views when creating geometry elements and features. This makes it more efficient to create measurement templates, since interactions with dialogs can be reduced or completely omitted.
Nominal/Actual Comparison
- ROI from a nominal/actual comparison: Creating an ROI from nominal/actual comparison components makes them directly available for further use in practically everything that works on ROIs, e.g., alignments, object conversions, analysis, or component geometry corrections. This way, the surface areas with a certain deviation range (components) immediately become available for further processing, e.g., to apply dedicated render settings, exclude or include the areas from further analysis, or surface extractions. These workflows can also be completely automated.
Porosity/Inclusion Analysis
- We've optimized the performance of the sub-voxel accuracy mode in VGEasyPore, allowing for a faster calculation of a sub-voxel accurate defect detection with a high number of defects. (New in 3.4.3)
- The equivalent defect diameter is now available for all three-dimensional porosity/inclusion analyses. The equivalent diameter of a defect is the diameter of a sphere that has the same volume as the defect. The equivalent diameter has the benefit of being easier to understand than the defect volume. (New in 3.4.3)
- Rectangular reference faces for 2D porosity analyses according to P 202 and P 201: By allowing the use of rectangular (instead of square) shapes to define reference faces in accordance with P 202 specifications, the analysis area (i.e., the shape of the reference face) can now be better adapted to the area of interest.
- Increased performance for porosity/inclusion analysis on ROIs: You now benefit from an improved performance when calculating a defect detection analysis on ROIs and extracted ROIs using internal cleaning.
Foam/Powder Analysis
- The equivalent cell/grain diameter is now available for foam/powder analysis. The equivalent cell/grain diameter is the diameter of a sphere that has the same volume as the cell or grain. The equivalent cell/grain diameter has the benefit of being easier to understand than the cell/grain volume. (New in 3.4.3)
Structural Mechanics Simulation
- We've made the default order of columns for SMS stress export more systematic and clear, from aggregate scalar values (used to identify the locations of stress export within each integration mesh cell) to corresponding full tensor components. When an integration mesh is used to export stress values for postprocessing in 3rd party software, the columns will now be in the following sequence: integration mesh element ID, coordinates, and scalar stress values (von Mises, max principle, max shear, magnitude of displacement, displacement vector, components of stress tensor). (New in 3.4.3)
All Analyses
- Because the active column is now doubled on the colors tab of all defect detection analyses, you no longer have to go back to the "Settings" tab to change the active column (and thus the information presented by the color overlay and the annotations).
Macros
- Saving of last-used automation elements: Because the application now remembers a set of macros and automatically makes it available after startup, you no longer need to manually prepare the application after each startup in scenarios where the same workflow is used repeatedly for a longer period of time.
Reporting and Traceability
- The new reporting function offers a new display of the data source names of tables and lists in report sections while in edit mode. This allows you to see the data source (e.g., defect table) that is being used by layout elements and which elements share a common data source. (New in 3.4.5)
- "Save image(s)" stores last-used settings: When manually inspecting a part and creating a series of images, "Save image(s)" now remembers the last settings that were used, such as resolution or picture-in-picture mode. This makes your inspection process faster and smoother, especially in combination with the new shortcut for the quick play of macros.
* Depending on the platform, there are differences in the range of functions for different operating systems. See our continuously updated Product Information page for details.
Volume Graphics GmbH
Speyerer Straße 4-6
69115 Heidelberg
Germany
Phone: +49 6221 73920 60
Fax: +49 6221 73920 88
Sales enquiries:
sales@volumegraphics.com
Modifications and errors reserved.


