This page is not compatible with Internet Explorer.
For security reasons, we recommend that you use an up-to-date browser, such as Microsoft Edge, Google Chrome, Safari, or Mozilla Firefox.
What's New in VGSTUDIO MAX
Discover the Exciting New Capabilities of Version 3.5 (as of December 2021, Version 3.5.2)
Version 3.5.2 of VGSTUDIO MAX is now available for download. Building on the innovations of version 3.4.x, you will benefit from the following new capabilities* in version 3.5.2:
Manufacturing Geometry Correction
Finding Points to Compensate
When compensating a geometry, a new filter option allows you to find fit points that cause inaccurate compensation results.
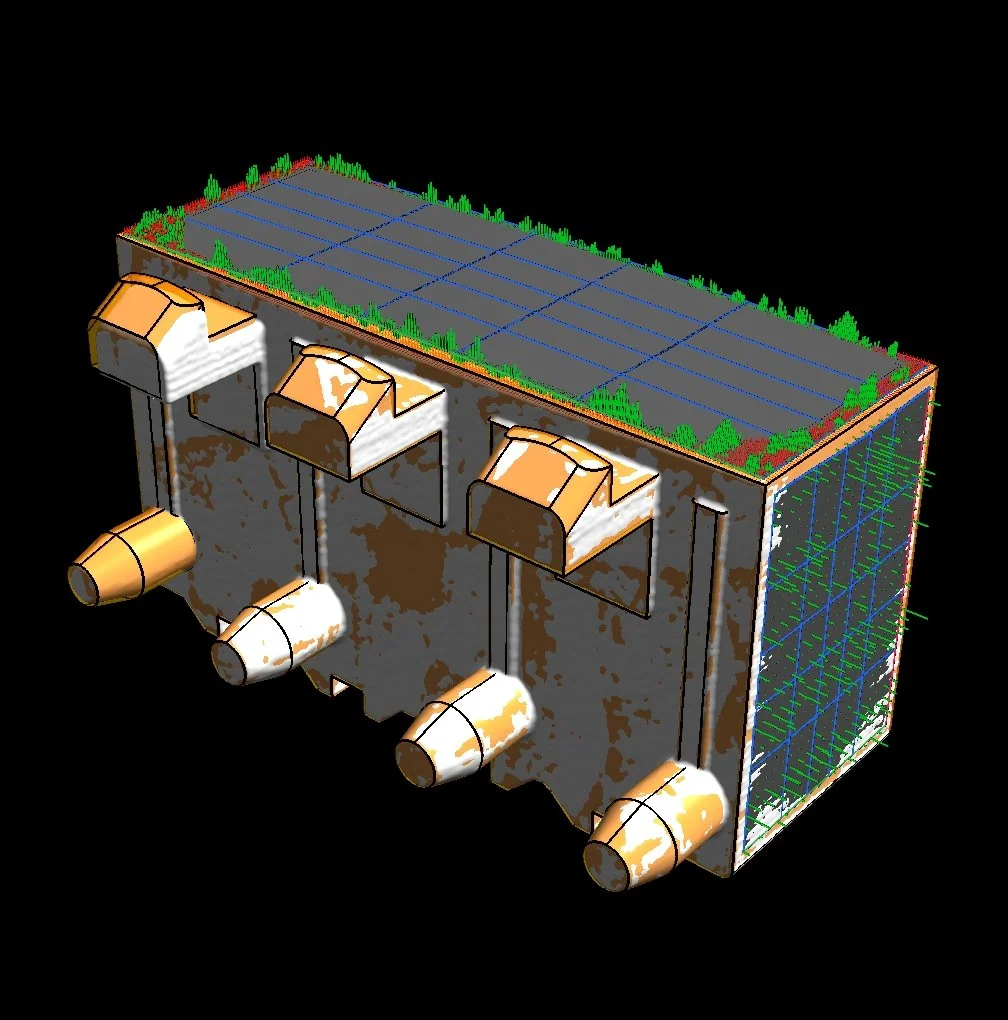
Compensating sections for closed geometry, such as cylinders, cones, or more complex cavities sections, gives you better control over compensated results for complex geometries that are derived by a loft (a function to create a surface or solid from a set of curves) in the CAD system, addressing draft angles better than a freeform surface.
Ways to Compensate
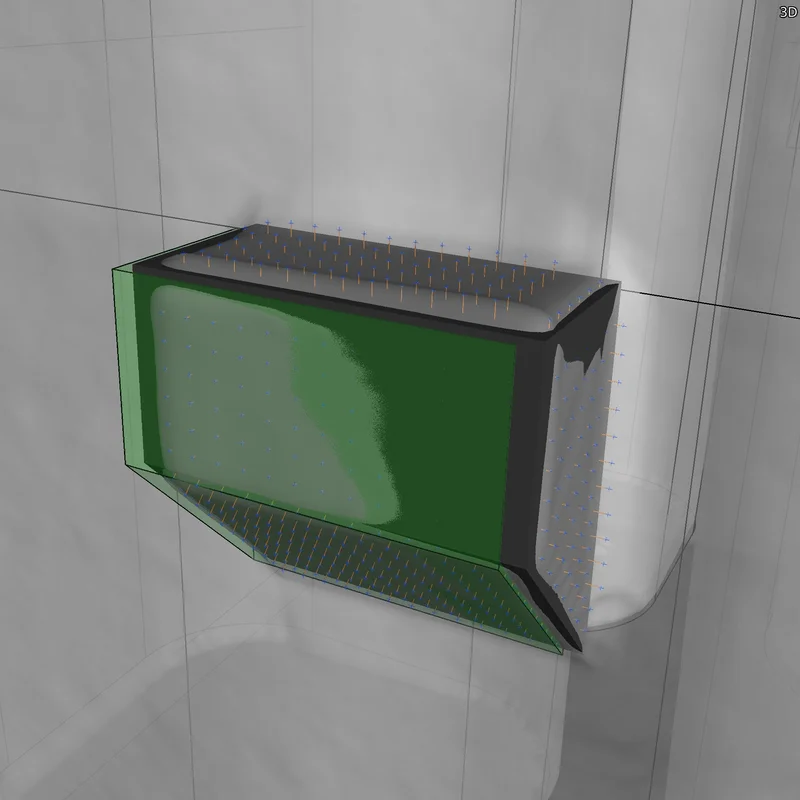
The option to rigidly compensate geometry elements allows you to compensate canonical geometries with more control over size and orientation. If you want to compensate a geometry, such as a datum plane, you can now add a constraint to move the plane to the best possible position without changing its shape or normal, all while maintaining manufacturability.
Also, you can now rigidly relocate patch compounds with constraints. This allows you to compensate areas consisting of a set of patches while keeping their continuity when you move them to an optimal compensation position, which ensures manufacturability. The compensated area will be easier to build back into the CAD model. You can control all degrees of freedom.

Visualization of Compensated Points
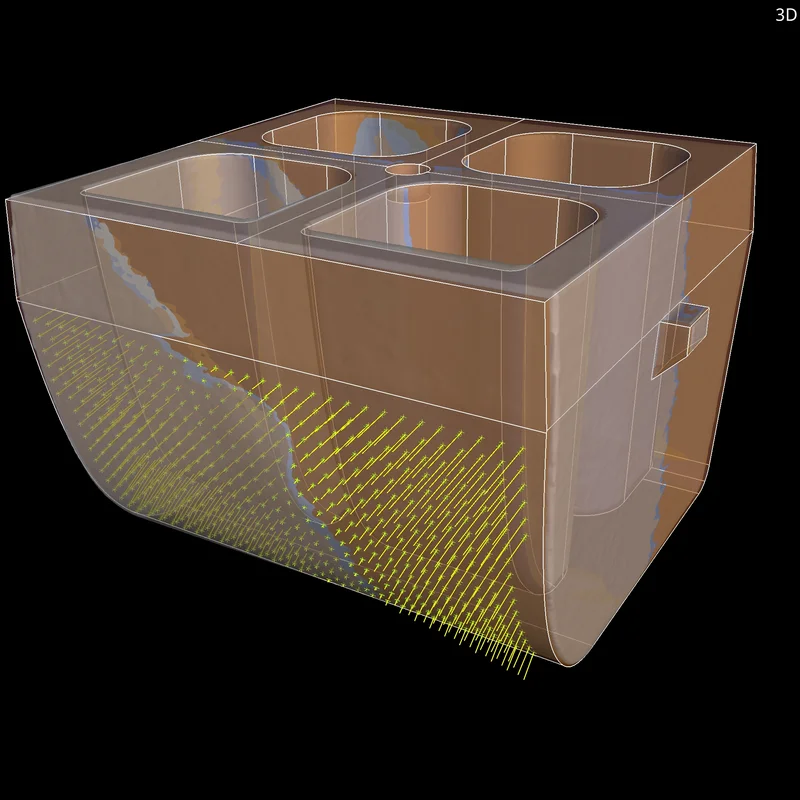
The visualization of compensated points give you a visual feedback on the results when compensating a geometry, allowing you to better interpret used parameters.

Fitting Surfaces to Compensated Points
Get better fitting results for any freeform surface. The improved surface fitting with user-controlled smoothness of surface offers better output quality and greater user friendliness.


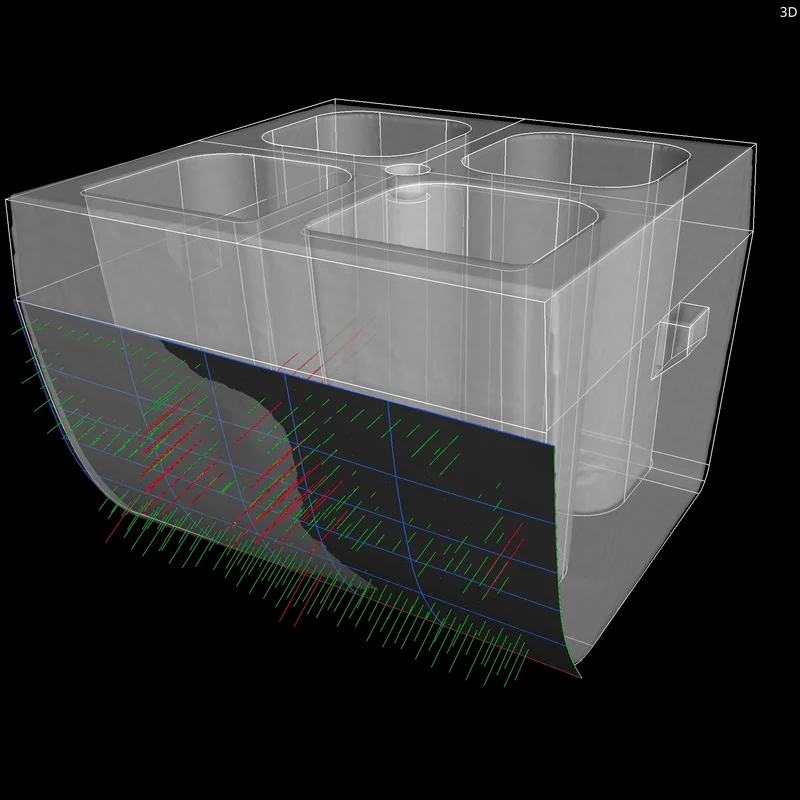
Receive visual feedback on the quality of the surface compensation by visualizing deviations between points and surface. Hairlines now indicate areas in and out of tolerance and allow for a better interpretation of used parameters.
You can instantly see how your changes affect surface fitting. The surface, which depends parametrically on the filtered points, will update in real time if the settings change. Real-time surface fitting improves your user experience and speeds up your workflow.

Eliminating the Need for Nominal/Actual Comparison between Nominal and Mold
Tool correction can now be performed without performing a nominal/actual comparison between nominal and mold in advance. This results in a more streamlined workflow that yields better results due to more sensible point placement. Until now, nominal/actual comparisons have often produced artifacts that needed to be eliminated by using filters (if they could be eliminated at all), causing suboptimally compensated surface results.

Transform Specific Points for Compensation during Import
You can now import specific points for compensation to the Manufacturing Geometry Correction module that have a different alignment in their CAD description than in the tool space. As the part in the tool is often aligned differently than in its original design, the defined points for a compensation need to be transformed from the part’s nominal position (in its assembly) to its position in the tool to produce useful results for compensation.

Mesh Compensation (Part of the Manufacturing Geometry Correction Module)
Compensation Mesh for Additive Manufacturing
Easily create a surface mesh that compensates for the difference between the actual object and a reference object. Since version 3.4.5, this feature saves you time by reducing the number of iterations as opposed to a trial-and-error approach for the final printing geometry optimization. You can compensate the mesh sent to a 3D printer to eliminate deviations caused by distortions in the nominal geometry. Such distortions are inherent in the 3D printing process and may even remain after a previous optimization based on a 3D printing simulation.


Improved Mesh Compensation User Interface
In version 3.5, the user interface for mesh compensation has been redesigned to improve your user experience for existing capabilities while adding new features.

Compensation Mesh Color Overlay
A new compensation mesh color overlay helps you clearly visualize the displacement in the compensation mesh, allowing you to analyze and annotate displacements.


Control Points and Compensation Vectors Visualization
Gain a better understanding of the behavior of the model by visualizing control points and compensation vectors/deformations.

Better Results for Large Deviations
Get more stable and reliable results when working with scan and reference objects that differ greatly in size or show other significant deviations.


Manual Control Points Placement
If the automated placement of control points does not deliver the desired results, you now have the option of manually defining the placement of control points used for compensation using geometry elements and defined points.

Uniform Control Points Placement
For more reliable results on complex parts, you can now use a new uniform control point placement mode. It improves control point placement in situations where the location of control points has not been properly determined or features are uniformly spread out in the model.


Iterative Compensation Process
Add up compensation mesh results for an iterative compensation process. This addition of results helps when one iteration does not fully compensate the deviation.

ROI as Reference Object
When only a part of the model needs to be compensated, you can now use ROIs to limit compensation on a specific area.


Better Uniform Control Point Distribution in Mesh Compensation
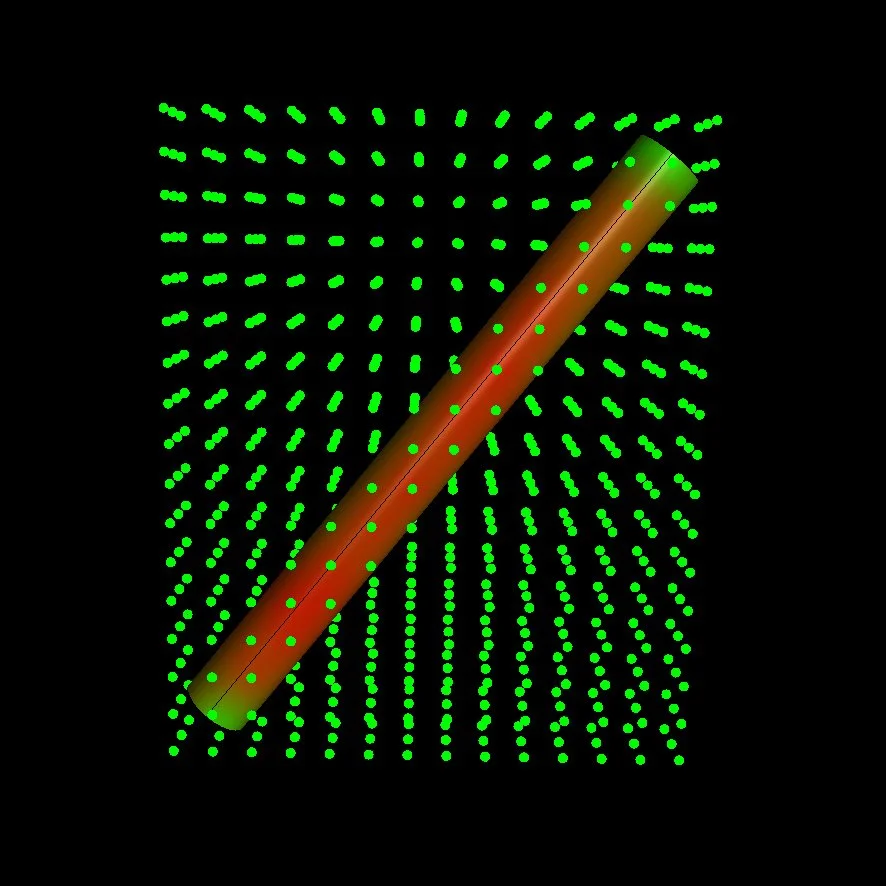
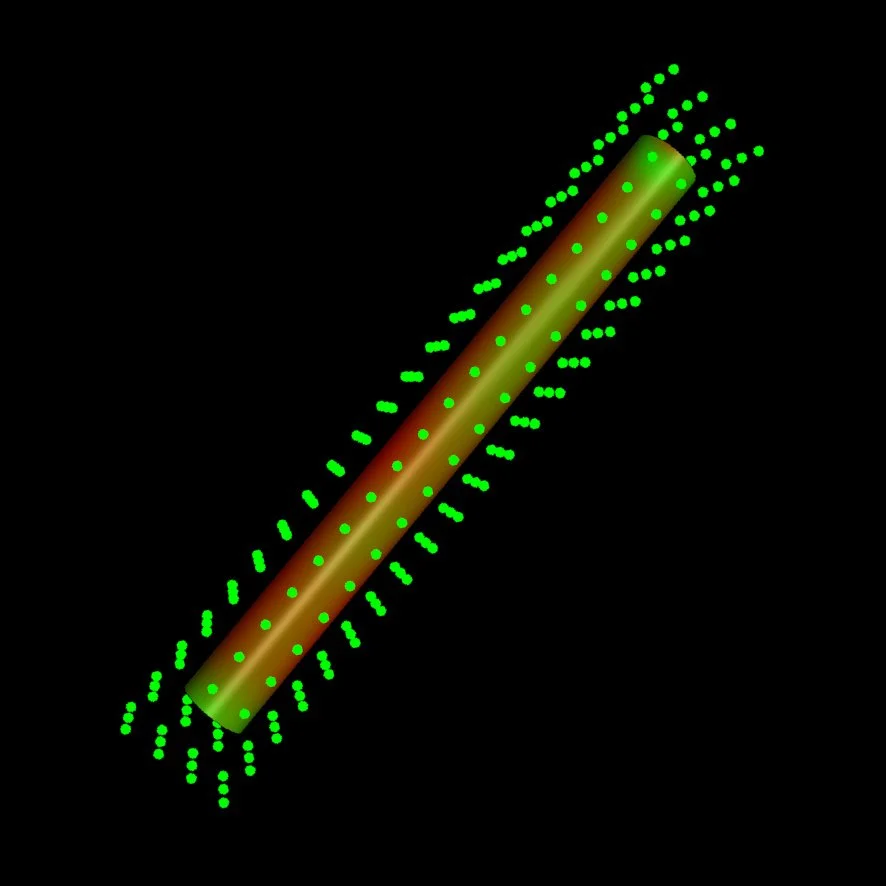
When compensating a mesh using the uniform control point method, control points are now better aligned to the part, which reduces the number of points needed while producing better results. The distribution of the control point grid now corresponds to the shape of the object as opposed to the voxel space.

Wireframe View for Compensation Mesh Preview
Previewing the result of selected compensation mesh parameters as wireframe saves time when iterating parameters.


Add Two Compensation Meshes Considering Their Compensation Factors
You now have the option to add two different compensations with different scales in a single tool correction workflow (for example, compensate part deviations and tool shrinkage) using the compensation mesh approach. Get a full STL model of the compensated tool, in addition to individually compensated CAD faces. This can be used to export a compensated tool to VISI's "target driven deformation" or for sintering processes where change happens in two process steps.

More New Mesh Compensation Features
- Compensated mesh visualization in the Scene Tree: For easier navigation and a better understanding of the relation between elements, deformed meshes are now visualized as part of the analyses in the Scene Tree.
- Faster compensation mesh updates: After the first calculation, updates calculate roughly 10 times faster, providing quicker previews of calculation results when parameters are changed and allowing you to find suitable compensation parameter settings faster without creating unnecessary objects in the Scene Tree.
- No set number of maximum control points: More control points allow for a more granular and accurate compensation of very complex parts, such as lattice structures, or parts with a high number of small features. By removing the maximum number of control points, the maximum number of control points is now mainly limited by the processing power of your system and can be as high as 1000 (instead of 100 in previous versions).

Porosity/Inclusion Analysis
Support of BDG Reference Sheet P 203
Inspect cast parts for porosity according to the Reference Sheet P 203 of the Federation of German Foundry Industry (BDG). Starting with version 3.4.5, the Extended Porosity/Inclusion Analysis Module supports the BDG P 203 analysis. With the help of the porosity key according to BDG P 203, you can now perform a 3D evaluation of detected volume deficits both in the complete casting and in freely defined sub-areas, such as functional areas with special attributes. Together, VGSTUDIO MAX and Q-DAS qs-STAT now cover the complete loop—from specifying porosity tolerancing criteria according to BDG P 203 by the product designer to statistical process control by the quality engineer:
- Generate porosity keys via an intuitive interface, define a reference volume according to the inspection plan using the ROI functions of VGSTUDIO MAX, and get a quick overview of all global tolerancing criteria and results for the BDG P 203 analysis.
- Evaluate volume deficits and independently tolerance different ROIs in one BDG P 203 analysis, flexibly combine the tolerancing and filtering of discontinuities based on their characteristics, and evaluate freeform reference volumes (ROIs) within the object's boundaries (surface).
- Document BDG P 203 analysis results by using "Reporting via Excel"—or the new integrated reporting function.
- Export BDG P 203 analysis results to Q-DAS to qualify and statistically analyze your casting processes.


New BDG P 203 Functions
Building on the features introduced in version 3.4.5, the BDG P 203 analysis in version 3.5 offers a streamlined user interface and an "Only Threshold" algorithm for porosity segmentation, which may be a requirement of the inspection plan. Usability improvements include combining the generation and editing of global and freeform porosity keys in one dialog and a new BDG P 203 name field that allows you to add a comment for each porosity key.

Support of the Quality Factor Q acc. to BDG P 203
The BDG Reference Sheet P 203 proposes a quality measure of the CT scan called "Q factor," which is now supported in Volume Graphics software. The Q factor is a simple approach for verifying the quality of the gray value volume and documenting the quality of your CT scan data directly in the P 203 analysis. You can see the user-independent and automatically determined Q factor information even without performing the P 203 analysis, so you can decide prior to the P 203 evaluation whether the data quality fulfils minimum image quality requirements.


Automatic Porosity Key Annotations for Porosity Analysis acc. to BDG P 203
You can now automatically display the corresponding BDG P 203 porosity key and the analysis results for each analyzed freeform partial volume (ROI) in the 3D window and the 2D windows. This simplifies the evaluation of the porosity analysis as well as the orientation in the examined data set. Quick OK/NOK ("not okay") decisions can be made and documented.

NOK Count Function and Display of Out-of-Tolerance Pores in the Porosity Analysis acc. to BDG P 203
You will now receive the number of NOK ("not okay") pores for selected porosity parameters that are out of tolerance within the global volume and within a freeform partial volume (ROI). This allows you to differentiate between outliers and a systematic production problem, which leads to better process control.
In the result table of the P 203 porosity analysis, a new “Out-of-tolerance values” column is now displayed. The purpose of this new column is to present the most important information in a compressed manner. You can easily see the pore values that are not within tolerance, the worst pore values that are out of tolerance and—at the same time—how many pores are out of tolerance for the toleranced porosity parameters (NOK count).


P 201/P 202 Porosity Analysis with Improved Support of VW Specifications PV 6097 and PV 6093
If you want to explicitly use the PVs (Pruefvorschriften) of Volkswagen AG for the 2D porosity assessment acc. to BDG P 201 and P 202, you can now benefit from result keys that are formatted according to Volkswagen's PV 6097/PV 6093 and take special VW rounding rules into account.

More New Porosity/Inclusion Analysis Features:
- Automatic annotations for out-of-tolerance pores in porosity analysis acc. to BDG P 203: To see the most critical discontinuities in 3D window and the 2D windows, you can now let VGSTUDIO MAX automatically generate annotations for a limited number of pores that are out of tolerance.
- Improved P 201/P 202 porosity analysis interface: All 2D porosity parameters and formatting examples that can be toleranced by P 201/P 202 porosity keys are now visible in the user interface. This will help you, for example, in situations where you want to define porosity keys without knowing the exact formatting of the porosity key string. In addition, the rules for formatting the keys are less strict.

Equivalent Pore Diameter
Calculate the equivalent pore diameter for three-dimensional porosity/inclusion analyses in the analysis modes VGEasyPore, VGDefX/Only Threshold, and P 203 Analysis. Introduced in version 3.4.3, the equivalent diameter of a volume deficit is the diameter of a sphere that has the same volume as the volume deficit (for example, a gas pore or shrinkage porosity). This has the advantage of not having elongated, hose-like volume deficits with only slight compactness and/or sphericity represented as huge pores with an excessively large pore diameter.

Reporting and Traceability

New Integrated Reporting
Edit and view reports in Volume Graphics applications exactly as they would appear in the PDF. The completely new integrated reporting function introduced in version 3.4.4 lets you customize reports, automate their creation, and store them directly in your .vgl project:
- The new integrated reporting function is a fast way to create presentable .pdf reports without having to switch to external software, such as Microsoft Excel, and is available across our products, even in our free viewer applications myVGL and VGMETROLOGY VIEWER. And because creating and exporting reports are macro-recordable, the new reporting function is also available for automation and VGinLINE.
- The new WYSIWYG (What You See Is What You Get) editor makes it easy to create a more digestible view of your project data. You can create reports that contain all or a subset of the reportable content in the scene and customize the displayable content, such as images, table columns, and page layouts. Additionally, data sections in the report, like selected metainformation, volume information, analysis settings, and result images, can be reordered or removed altogether. Once a custom layout has been created, it can be stored and reused when similar content is to be reported.
- The new reporting function is introduced as an additional option and will be continuously enhanced in the future. Reporting via Excel will continue to be supported, while the existing integrated .html reporting with its current scope of functionality will remain available for a limited period of time.

Advanced Table Properties in Report Editor
Advanced table properties in the new WYSIWYG report editor give you full control over the page count of your report and let you focus your reports on aspects that are especially relevant. While the software creates the full set of results, you can now customize the sorting of rows within tables and limit the displayed rows to display only a subset of result components (for example, defects) or control the order of images (for example, to display the largest defects first).


Ordering Page Elements in Report Editor
Change the order and position of elements on a page to create customized report layouts in the WYSIWYG editor. You can now determine the element positions by entering numerical values, which comes in handy when you want to align elements with each other or easily compose text content and graphical elements by controlling the order of elements via the context menu.

Customizable Report Sections and External Images
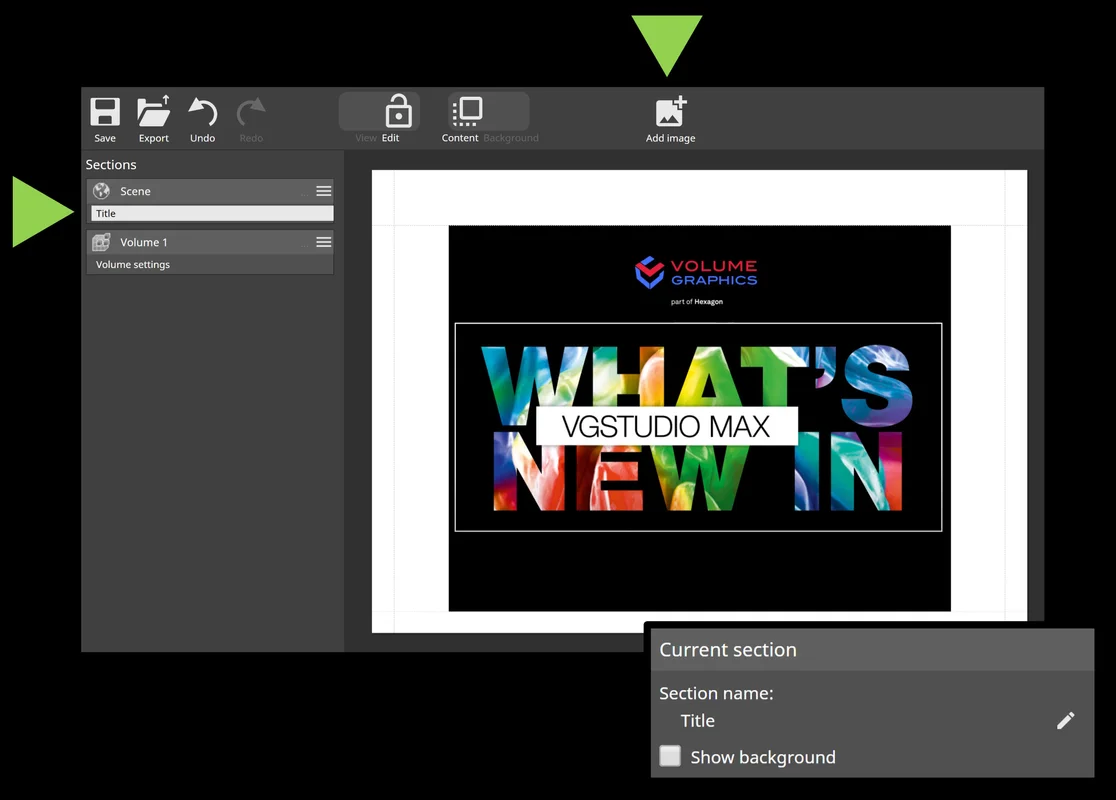
Customizable report sections and images from external sources give you even more flexibility for your report layouts. In the WYSIWYG editor, you can now add empty sections, rename sections to more accurately describe their content, and enable/disable the background for individual sections. By incorporating external images, you can mix content created in Volume Graphics software with relevant external content to create stunning visuals, such as for impressive title pages.


Q-DAS Export for Porosity/Inclusion Analysis Results
Use porosity/inclusion analysis results for process qualification or statistical analysis. Starting with version 3.4.5, you can export toleranced, global porosity/inclusion analysis results and related tolerances in the Q-DAS ASCII transfer format for use in statistics software, such as qs-STAT from Q-DAS.

Improved Q-DAS Export for More Analysis Results
Improved Q-DAS export for toleranced, global wall thickness analysis, nominal/actual comparison, and fiber composite material analysis results allows you to easily transfer these results to statistics software, such as Q-DAS qs-STAT, for process qualification or statistical analysis.


More Customizable Report Layouts
Create entirely new report page layouts by combining arbitrary information from reported objects, for example, to create overview sections or sections that contain multiple result images of a part. You can choose from images, attributes, tables, and info fields and arrange them flexibly to customize the way results, settings, images, and other information are presented on report pages.

Resizing and Re-Ordering Table Columns in Reports
Customize the order of table columns and the size allocated to the individual columns directly in the report editor. For example, you can group important columns, move columns to the beginning of the table, and optimize the use of space on report pages by resizing columns. This feature brings customization options similar to the tables used in the original application dialogs to the new report editor.


Add Static, Dynamic, and Custom Text Fields to Reports
Use new customization options to add text from the reported data or text entered by the user to your reports. Text from report data, such as group or image names, can be placed anywhere in the report, and user-entered text can be further customized by changing its size or text style (bold, underline, and italics).

Copy and Paste Images from Other Applications into the Report Editor
Easily insert images from your drive or from other applications, for example, Microsoft PowerPoint, with copy and paste into the report editor. This saves time by removing the need to save and load images via file dialogs and simplifies workflows where external tools are used to generate report content.
Copy and Paste Text from Other Applications into the Report Editor
Use copy and paste to easily insert text from other applications, for example, Microsoft Word, into the report editor. This allows you to easily re-use text from other sources such as specification documents or part descriptions.


Place Arbitrary Report Content in Sections via Absolute References
With absolute references, you enjoy an entirely new level of customization in reports by adding content that may reference any results anywhere in a report. For example, you can now create title sections that reference arbitrary results from a report, overview sections that aggregate several results, or comparison pages that put similar results next to each other.

More Info Field Options in Reports
Customize your reports by changing the format of the displayed report date/time or project file path or by displaying the name of the reported object on a page, by means of additional info field options for report background and sections. This gives you more control over the way information is displayed on report pages, regardless of system date/time settings, and, in general, more customization options.

Multi-Selection and Copy and Paste for Report Layout Elements
Re-arrange or duplicate existing layout elements by using multi-selection and copy and paste when creating custom report pages. This saves you valuable time, because you no longer have to reposition elements individually or go through the main edit menu to multiply elements.

Re-Ordering of Section Groups in the Report Editor
By changing the order in which the pages of reported objects are displayed in the report, you can now semantically group report pages, even if the reported objects are at different positions in the scene hierarchy.

More New Reporting and Traceability Features:
- Indicator for selected elements in the report editor properties bar: When you edit element properties in a report, for example, when you change the displayed columns of a table, the properties bar now clearly indicates the element properties that are being edited and the resulting changes on the report pages. Edited elements are automatically shown and there is an indicator if the selected element is currently not visible.
- Built-in sections for multiple images on a single page: You can now make reports shorter by using sections that place multiple snapshots, bookmarks, or automatically created images on a single page. These new built-in sections provide more flexibility and can also be used as an example of creating entirely customized multi-element sections.
- Support for digital volume correlation (DVC) analysis results: You can now include default sections for the results of a digital volume correlation analysis in reports created with the new report editor.
- Displaying the actual tag names for custom metainfo fields when editing a report: With the new preview function when metainformation fields are added, you can now easily identify the relevant tags without having to add them to a page beforehand.
- Updating reports using custom default report layouts: Newly added objects can now automatically be displayed in the same layout as the objects at the time of the original report creation, making it easier to create consistent reports. An example of this is when an existing report needs to be updated with newly added scene objects that were not part of the initial report.

Support for Specific Report Templates
Support for Specific Report Templates
Re-create reports by using customized layouts for the content of a specific scene configuration, either automatically or manually. This allows you to easily create highly customized reports that exactly match and display the results of a specific type of inspection.

More New Reporting and Traceability Features:
- Rename referenced bookmarks directly on the "Images" tab: You can now conveniently rename bookmarks directly on the "Images" tab without accessing the "Bookmarks" tool or the "Bookmark editor."
- P 203 quality factor support in reports: The quality measure of the CT scan called "Q factor," proposed by the BDG Reference Sheet P 203, is now included in reports, which gives you a more complete picture of all parameters related to a P 203 analysis.
- Change the data assignment of multiple elements at once: You can now more easily create custom sections that display multiple images or tables in reports, which saves you time as you no longer need to individually select all layout elements that should display the same content.
- Display the layout element type: You can now see the type of layout elements when you customize report sections, which helps you better understand the type of data individual layout elements display when you create custom reports.

Nominal/Actual Comparison
Automated Annotations for Min./Max. Deviations
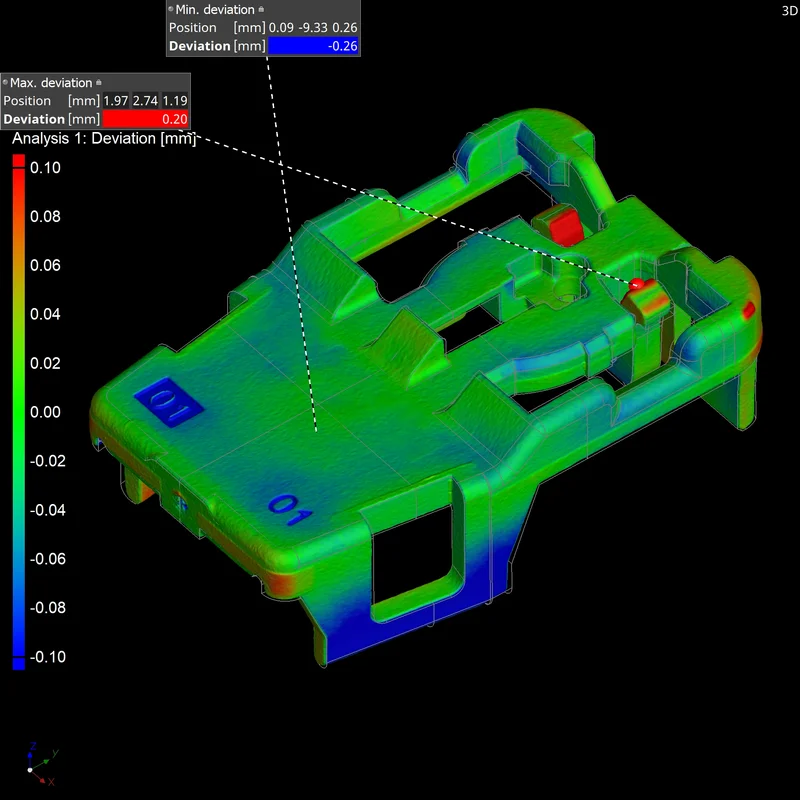
A new option allows you to automatically create annotations for min./max. deviations when performing a nominal/actual comparison. This makes extreme points visible at a glance.

Faster Nominal/Actual Comparison Calculations
We've accelerated the calculation of nominal/actual comparisons. You'll notice generally shorter calculation times. In addition, a new preview mode, which delivers a quick color fail plot in just a few seconds, speeds up the setup of inspection plans. In addition, the option to disable statistics calculation can save you a lot of processing time, especially in in-line scenarios.

File Input/Output
TXM Volume Import
Directly import high-resolution volume data from ZEISS Xradia CT systems, including the correct settings for orientation and dimensions. Starting with version 3.4.5, support for the TXM format, which is typically used when analyzing the microstructure of material samples, eliminates the need for a time-consuming export of DICOM or TIFF on the CT system and their manual import into VGSTUDIO MAX.

HiXCT Multiple Volume Import
Load volume data from Hitachi Industrial CT systems. Version 3.4.3 (and higher) can import files in the HiXCT format, which is typical for Hitachi Industrial CT systems. This format optionally supports volumes coming from a multi-circle scan.

Window Options when Saving Images
Save either the currently selected workspace window or a manually defined combination of workspace windows with a new save image option introduced in version 3.4.5. Depending on your manual inspection workflow, either may be more convenient for you—the new option in the dialog allows for both while keeping the shortcut and automatic storage of other image settings unchanged.


Save Image of Complete Workspace
Save an image of the complete workspace as is. Since this new save image option is WYSIWYG, the created image reflects the overall size of the workspace and maintains the exact window positioning, even for irregular layouts.

More New File Input/Output Features
- Import multiple files at once with the "Quick Import" feature: The settings chosen for a specific file type will be applied to all following files of the same type, reducing the amount of user interaction.
- Import files with drag and drop: Hold the alt key and drag the files to the application holding the left mouse button. This is much more intuitive than the previous option, which was performed with the right mouse button.

Rigaku Volume Import
Directly import high-resolution volume data from Rigaku CT systems, including the correct settings for orientation and dimensions. This eliminates the need for a time-consuming manual import into VGSTUDIO MAX.

Merging Multiple Scans in One Go
By combining the contents of multiple project files in a single scene, such as when analyzing multiple scans of similar parts in the same way, you can save a lot of time compared to manually merging each individual project.

More New File Input/Output Features:
- Import volume files saved in HDF 5 format: Directly import volume files saved in HDF 5 format, which is used in research and by 3D-printing companies, without conversion.
- Improved Toshiba volume import: By supporting data mapping and clamping for 14-bit data sets, you can now load data sets with a data range other than 16 bit, and by changing default mirroring, Volume Graphics software displays the scanned part identical to the Toshiba reconstruction software.

Visualization and Navigation
Ambient Occlusion
Ambient occlusion gives 3D renderings in Volume Graphics applications more realistic shading and a feeling of depth. Without noticeable performance impact, the shading and rendering technique calculates how exposed to ambient lighting each point in a scene is. This provides realistic depth perception. It also improves the orientation in complex models and helps when visually inspecting and navigating in the 3D view. In computer graphics, this technology is known as Screen Space Ambient Occlusion (SSAO).


Improved 3D Rendering Performance in Scenes with Many Objects
Improved 3D Rendering Performance in Scenes with Many Objects
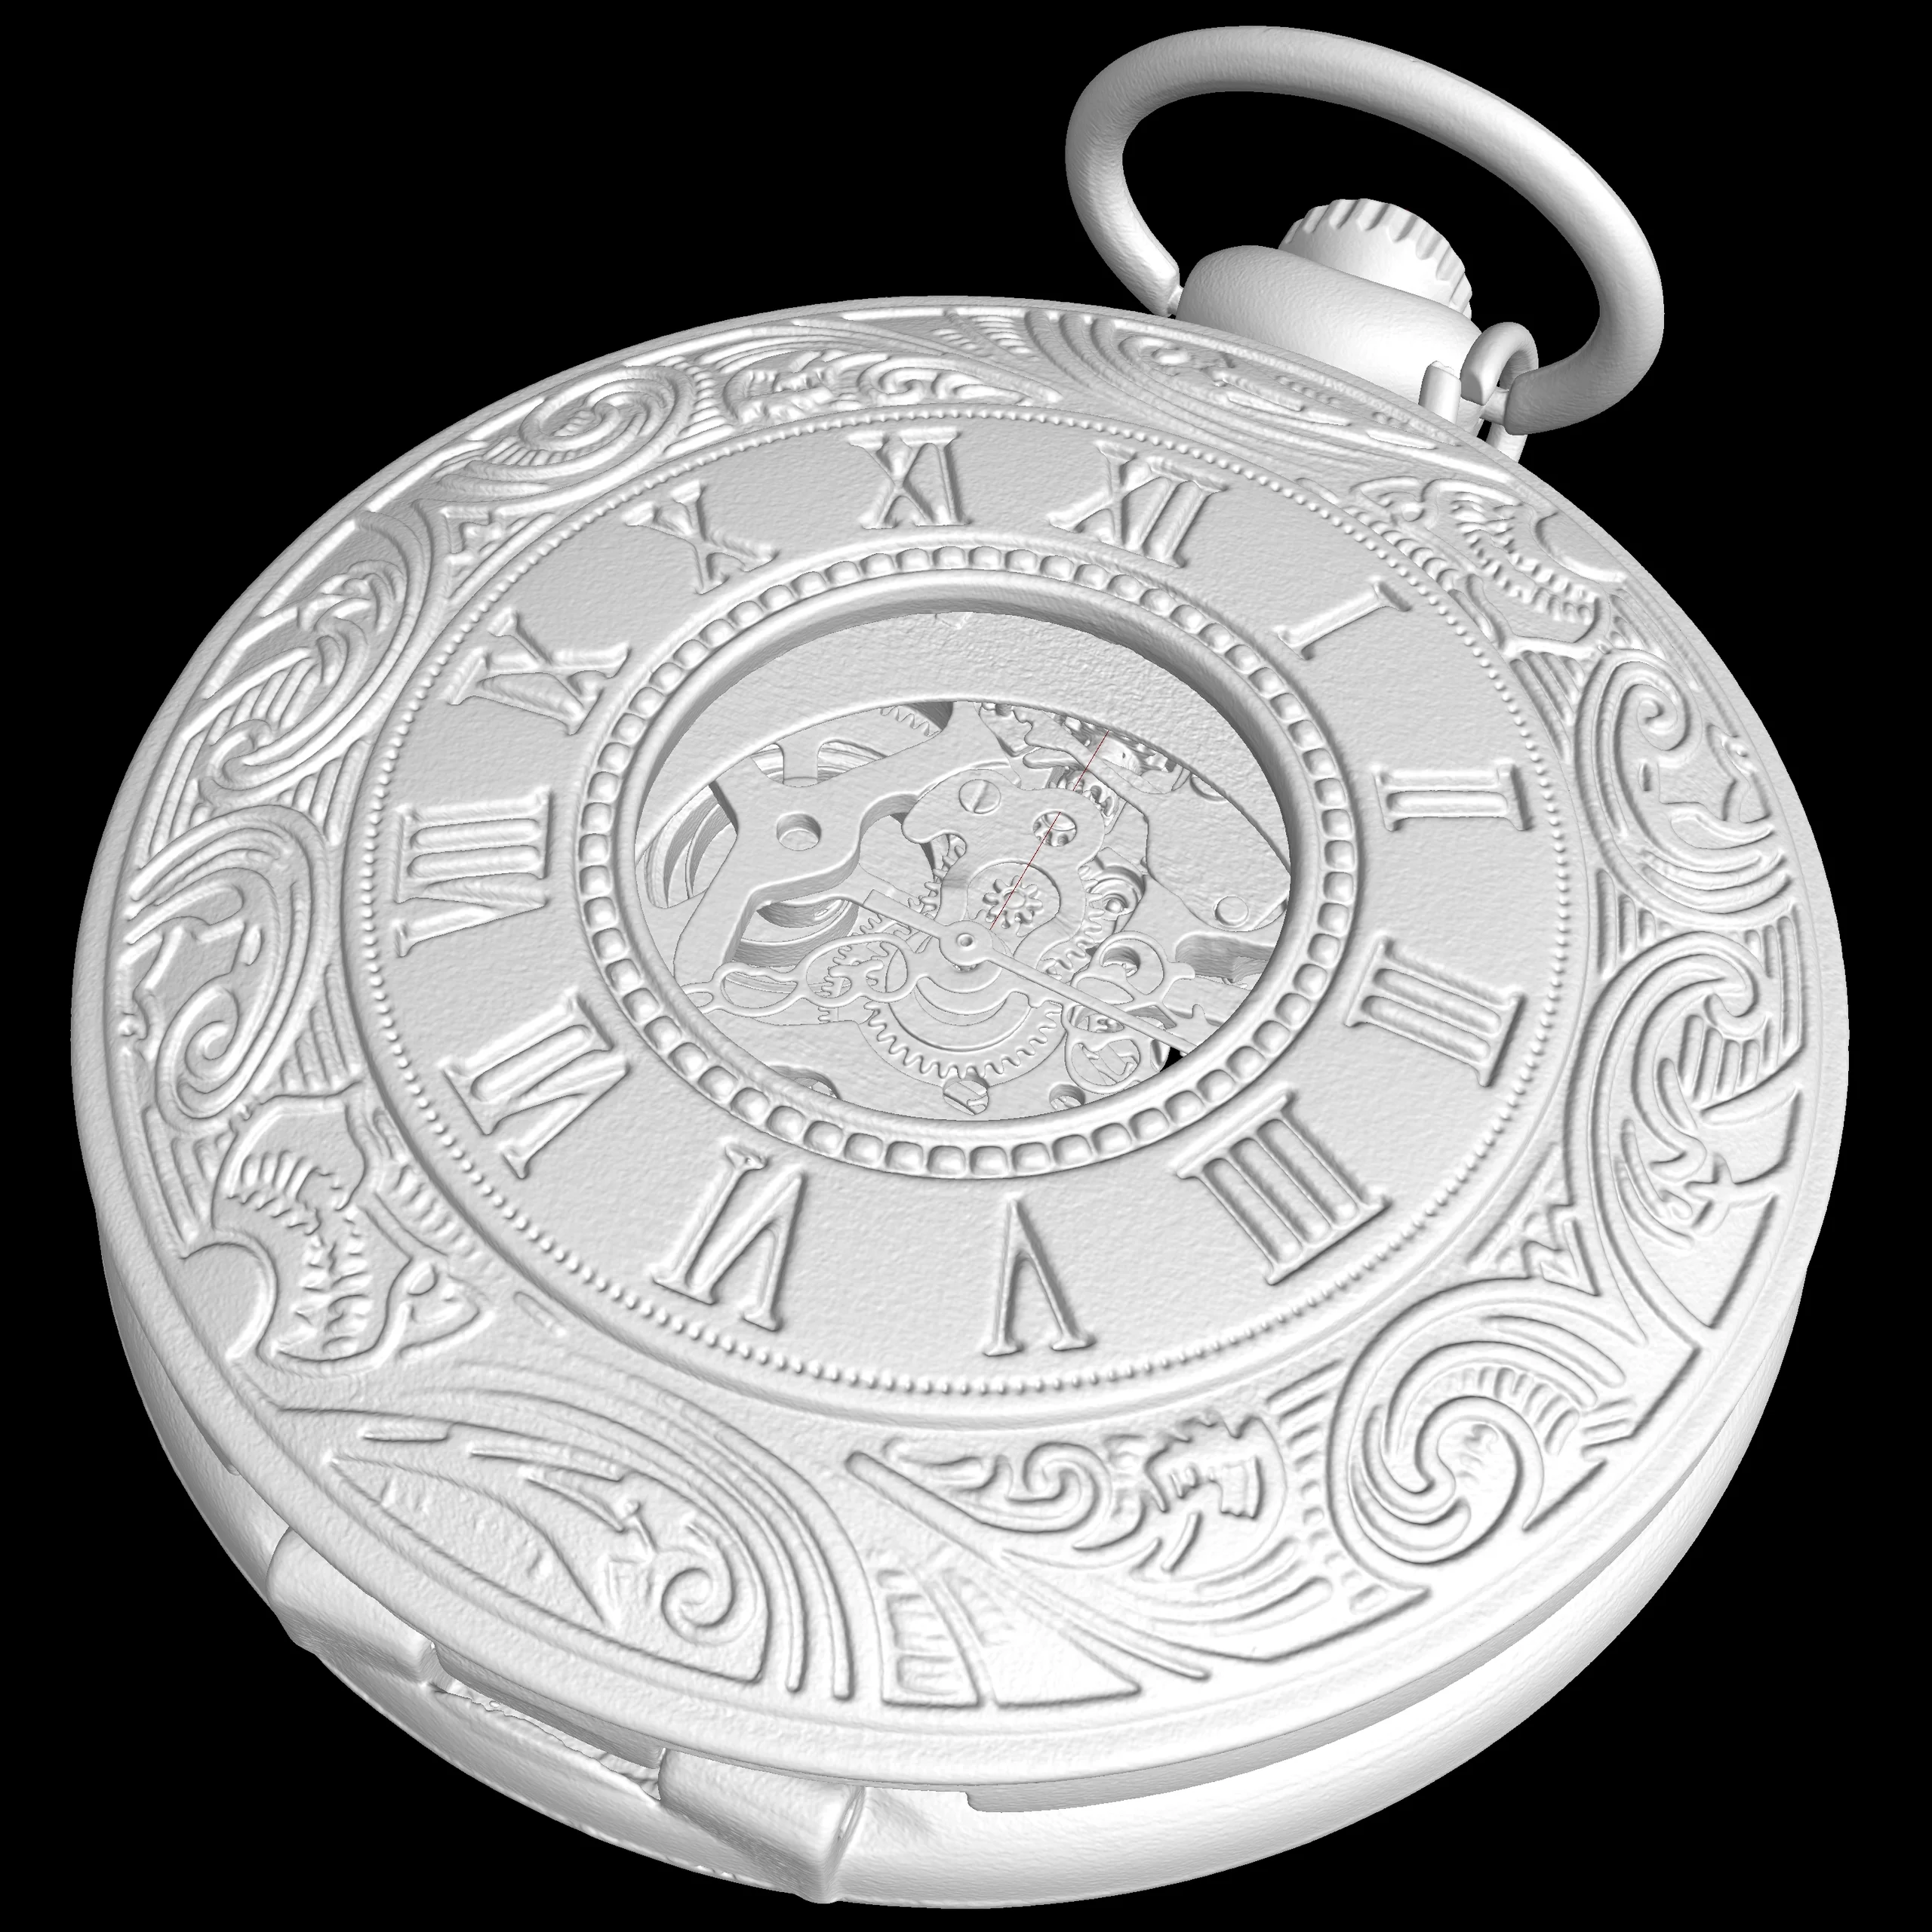
We've improved performance when it comes to rendering scenes that include a large number of ROIs and/or volumes, leading to a better user experience in heavily populated scenes, as is the case with multipart analyses and complex segmentations. The user experience is significantly improved by an up to 10 times higher frame rate, depending on the combination of items in the scene.

CT Reconstruction

Support of Angular Positions
Import JSON files to use actual angular positions. As of version 3.4.3, the software supports JSON files, which are based on an open, non-manufacturer-specific standard.

More New CT Reconstruction Features:
- Import Nikon parameter files: Use VGSTUDIO or VGSTUDIO MAX to reconstruct Nikon projection data directly from the CT machine—no manual copy and paste of parameters necessary—and benefit from advanced techniques, such as exact angle reconstruction and multi-ROI reconstruction.
- Import NSI parameter files: Use VGSTUDIO or VGSTUDIO MAX to reconstruct NSI projection data directly from the CT machine—no manual copy and paste of parameters necessary—and benefit from advanced techniques, such as exact angle reconstruction and multi-ROI reconstruction.

Coordinate Measurement
"Resize Element" as New Type of Geometry Element
A new combined geometry element type called "resize element" allows you to resize a geometry element without changing its fit points. You may use this feature to make a geometry element more visible, for example, by enlarging an axis to a certain point so the element becomes visible outside of its source element.

Mirroring CAD Models
Mirror a CAD model directly in Volume Graphics software. If, for example, you need to measure a mirrored part, but only the unmirrored CAD model was provided by the designer or customer, you can now perform the mirroring without any third-party CAD software.

More New Coordinate Measurement Features
- Improved CAD selection speed: The visualization of just the selected surfaces without fit points allows for the much faster creation of patch compounds when selecting a high number of CAD faces and adding them to a freeform patch compound.
- Selecting all CAD patches: When selecting almost all surfaces to create a GD&T callout, it may be much quicker to select all (with Ctrl+ Middle Mouse Button) and deselect a few than manually selecting them surface by surface. This comes in handy when you have to select a high number of CAD faces and add them to a freeform patch compound.

Improved Performance for Projects with Many Coordinate Measurement Objects
Working with a large number of coordinate measurement objects in one template (for example, multiple groups, geometry elements, local coordinate systems, and combined geometry elements), such as importing or editing the template, is now significantly faster. Performance improves up to 30%, depending on the combination of items in the scene.

Select and Remove Fit Points Using ROIs
You can now eliminate fit points in a specific area or only select fit points in a specific area. This allows you to avoid using points that do not belong to the feature or represent artifacts. To define the selection, you can use the complete set of ROI functions.


New User Interface to Manipulate Geometry Elements
A new user interface for geometry element manipulation improves usability with a consistent look and feel and enhanced interactivity.

More New Coordinate Measurement Features:
- Permanently remove fit points from freeform elements: Areas of the scan that are not to be evaluated (e.g., in the area of an injection point or numbering) for profile tolerances can now be excluded and removed.
- Improved best-fit alignment for symmetrical parts: We've improved the overall best-fit alignment, especially for almost symmetrical parts such as cubes, pipes, or disks.

Wall Thickness Analysis
Create ROI from Sphere-Based Wall Thickness Mask
Create ROIs from a wall thickness mask based on the sphere method for further analyses of regular (thick) structures, such as in lattices of additively manufactured parts. This allows you to quickly extract nodes in a lattice structure, among others.


Automatically Create Annotations for Ray-Based Minimum and Maximum Wall Thickness
By automatically creating annotations for the minimum and maximum wall thickness for the ray method, you can now identify critical areas and the exact positions at which the wall thickness is lowest or highest.

Reverse Engineering
Quad Mesh Preview
A new option allows you to preview the quad mesh, giving you feedback on the patch layout before you start the computationally intensive creation of the surfaces.


Use a Lower Number of Control Points for B-Splines When Converting Volumes to CAD Models
Create a CAD model using less control points for large scans or for complex shapes, where fitting a larger number of control points may fail otherwise. This method comes in handy when less accurate results are acceptable. Setting the control point count to 3 will generate B-spline geometries of degree 2, where the center control point will always be fitted to obtain a good approximation of the scan. In this case, the result will still be smooth, but only positional continuity can be ensured. This is usually acceptable, as many small faces will be produced where inner face deviations are not problematic. Setting the control point count to 2 will result in a plane-faceted model with only positional continuity between the faces.

Foam/Powder Analysis
Equivalent Cell/Grain Diameter
Calculate the equivalent cell/grain diameter for foam/powder analyses. Introduced in version 3.4.3. The equivalent cell/grain diameter is the diameter of a sphere that has the same volume as the cell or grain. It has the advantage of being easier to understand than the cell/grain volume.

All Analyses
Import Setting for Color Bars in Evaluation Templates
Import evaluation templates while keeping the settings for the color bar. Simply decide whether you want the global analysis color bars in the project to be overwritten by those stored in the evaluation template.

Alignment of Integration Meshes
To map data from all kinds of analyses into volume meshes, you can now change the position and orientation of the integration mesh. Aligning volume meshes according to the inspected volume objects or an externally provided coordinate system can be easily done by copying and pasting the transformation between arbitrary scene objects (e.g., volume meshes, surface meshes, CADs, and volumes).

Extended Import of ABAQUS as Integration Mesh
Import ABAQUS integration meshes in the .inp file format, including hexahedral elements in addition to tetrahedral elements. By broadening the interface for importing the ABAQUS .inp format in version 3.4.3, we are allowing you to map results of various analyses in VGSTUDIO MAX onto hexahedral ABAQUS FE meshes. Thus, you can enhance FE simulations with micromechanical information in software packages that support .inp files.

Volume Meshing
Sharp Edges in Tetrahedral Mesh Creation
Create tetrahedral volume meshes for components that contain sharp edges to get a better representation of the component geometry with a significantly reduced number of tetrahedral elements. When you activate this new option, which was introduced in version 3.4.4, the algorithm identifies sharp edges in the component and creates a mesh that reflects these edges by aligning FE nodes on them.


"Flip Edges" Option for Optimized Mesh Quality
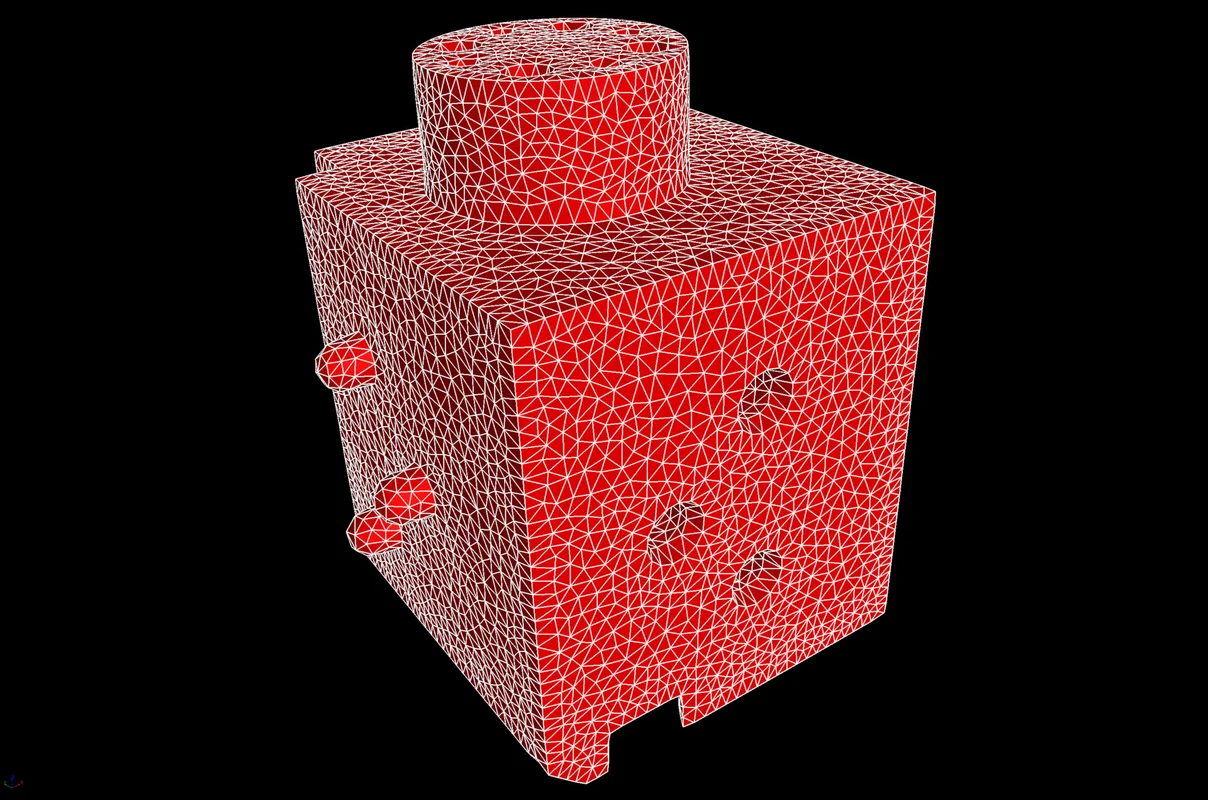
Optimize element quality of tetrahedral volume meshes using the "flip edges" option. Since version 3.4.5, the algorithm allows mesh nodes to reconnect differently, which will result in significantly improved local mesh quality.

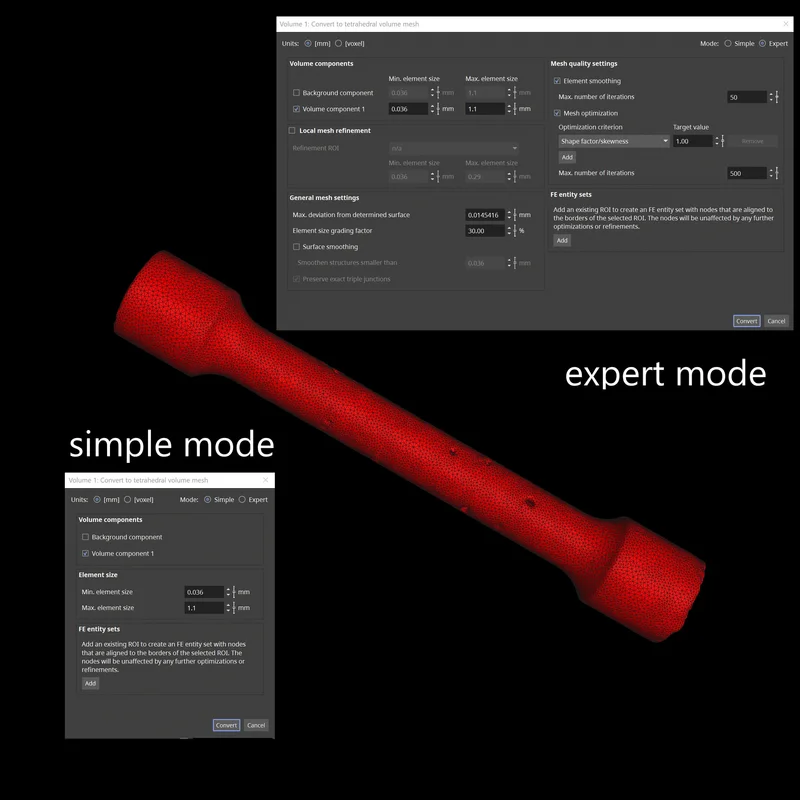
Simple and Expert Mode for Volume Meshing
Create high-quality tetrahedral volume meshes on CT data more easily. As of version 3.4.3, we've split the user interface for volume meshing into "Simple" mode for defining basic mesh properties and "Expert" mode for defining more advanced meshing options. "Simple" mode allows you to quickly and easily define the main settings, resulting in high-quality meshes for typical meshing tasks. "Expert" mode can be used to control advanced settings to further optimize mesh quality, if needed.


Visualize the Local Quality of Tetrahedra
By visualizing the quality of tetrahedra (tets), you can now see if low-quality tets are in critical regions and decide to skip re-meshing if low-quality tets are not in critical regions.

NASTRAN Export for Volume Meshes
Simplify your workflow when building NASTRAN simulation models based on CT data by using NASTRAN export for volume meshes. Starting with version 3.4.5, you can directly use tetrahedral volume meshes created in VGSTUDIO MAX for NASTRAN simulations without using another software, such as a FE preprocessor to convert them from PATRAN or ABAQUS formats into NASTRAN format.

More New Volume Meshing Features:
- Multiple refinement regions: To control performance and precision more effectively in finite-element (FE) calculations, you can now choose between different cell sizes (coarse or fine) for different regions of the scan, depending on how interesting the respective region is.
- Export of quadratic tetrahedral elements: You can now export quadratic TET10 tetrahedral elements for use in your simulations. Using quadratic tetrahedral elements leads to higher precision in classical finite element analysis (FEA) compared to linear tetrahedral elements.

Structural Mechanics Simulation
Improved Structural Mechanics Simulation Performance
You can now calculate large data sets faster with less memory. Simulations are now faster, while the reduced memory requirements allow you to run simulations on lower-end machines.

Mapping of von Mises Strain in Structural Mechanics Simulation
You can now map von Mises strain data to an integration mesh and export the data as a .csv file for additional calculation in a postprocessor. There is no need to use a spreadsheet for calculations based on the .csv export of the stress tensor field. Von Mises strain, which is an equivalent strain for ductile materials, is commonly used in static and fatigue analysis, among others, to compare it against particular material parameters, like the maximum allowable strain for a specific material.

Automation
Improved Display of Objects in Macros
You can now see used and created objects for all steps in a macro in the advanced automation tool, which allows you to better understand what a macro will do when played back and find reasons for possible playback errors.

More Detailed Macro Step Descriptions
More Detailed Macro Step Descriptions
You now see more information about the steps of a macro in the macro details, which helps you to understand what a step will do when executed. This also works with macros created in older versions.

Licensing
Using Floating Licenses with Previous Version
VGSTUDIO MAX and VGMETROLOGY floating licenses can now be used with the previous version, allowing you to install a new floating license file on the floating server without being forced into upgrading all clients at the same time. This makes the update process much easier when you want to upgrade many floating workspaces to a new major version. Backwards validity is available for VGSTUDIO MAX and VGMETROLOGY 3.4.4 and higher.

Multiple User Sessions on One Machine with Floating Licenses
Changes in the floating license mechanism now give you more freedom to choose where you work with VGSTUDIO MAX or VGMETROLOGY and make it more convenient to share hardware. The improved floating license mechanism may, for example, be useful in the following scenarios:
- You leave a large project open while attending a meeting to avoid reopening it when returning to your workstation. In the meantime, your colleague can use your workstation by switching to their Windows user account and work on a different project using a second floating license. When you return, you can switch back to your account and continue where you left off.
- You can leave the project open on your lab workstation and—without long reload times—access the open project on the lab workstation from your office to perform further analysis of the scan.

*Depending on the platform, there are differences in the range of functions for different operating systems. See our continuously updated Product Information page for details.
Volume Graphics GmbH
Speyerer Straße 4-6
69115 Heidelberg
Germany
Phone: +49 6221 73920 60
Fax: +49 6221 73920 88
Sales enquiries:
sales@volumegraphics.com
Modifications and errors reserved.

