This page is not compatible with Internet Explorer.
For security reasons, we recommend that you use an up-to-date browser, such as Microsoft Edge, Google Chrome, Safari, or Mozilla Firefox.
Foam Analysis
with VGSTUDIO MAX
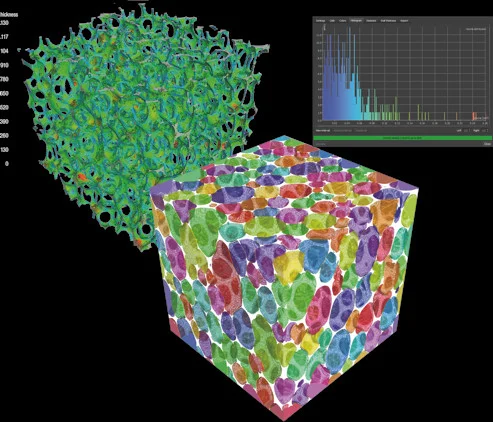
In large or high-resolution foam samples, there can be millions of cells, which makes it nearly impossible to separate them manually and challenging to handle such a huge amount of data. The easy-to-use foam analysis features in VGSTUDIO MAX allow you to quantify such structures and derive meaningful statistics for your application.
Separate and characterize individual cells within structures, such as open and closed cell foams to quantify them individually, visualize strut thicknesses locally, and aggregate both strut thicknesses and cell properties to global statistics, such as histograms or scatter plots.
Foam Analysis Functions for Determining Features on a Single-Cell Level
Cell Features
Cell Features
You can determine the following features for each cell:
- General:
- Position
- Mean gray value
- Size:
- Volume
- Equivalent diameter (diameter of a sphere with the same volume)
- Surface
- Shape:
- Sphericity
- Compactness
- Shape of fitted ellipsoid (from a Principal Component Analysis (PCA))
- Directional features:
- Projected length to a certain axis
- Projected area to a certain plane
- Orientation of fitted ellipsoid (PCA)


Face Features
Face Features
You can determine the following face features:
- General:
- Position
- Size:
- Face area
- Directional features:
- Surface normal direction
Statistics
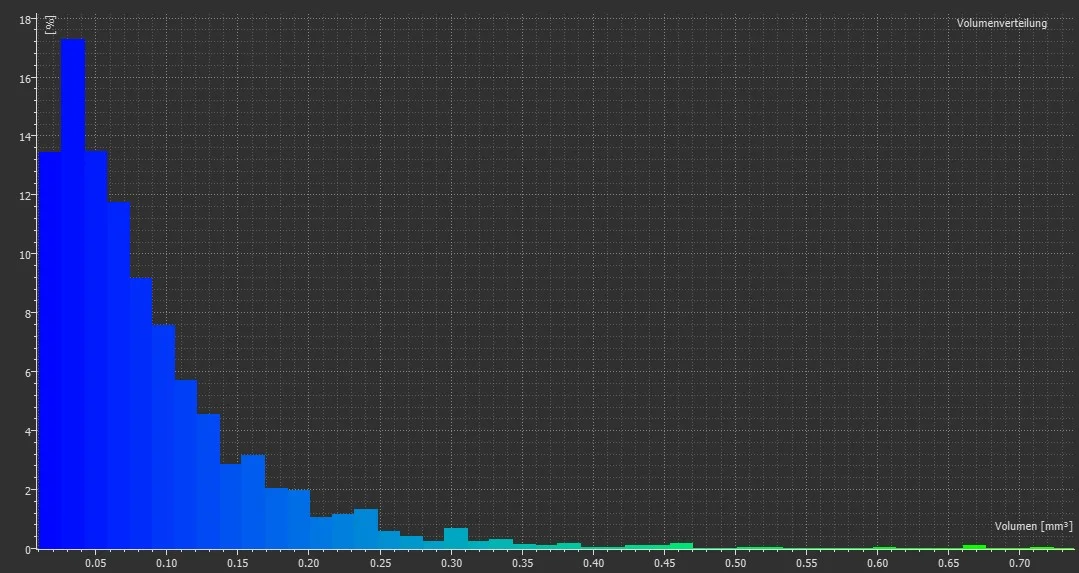
Histograms for Cell Features
Histograms for Cell Features
Generate histograms for cell features either globally or in regions of interest.
Available features are:
- Cell volume
- Equivalent diameter
- Surface
- Average gray value
- Sphericity
- Compactness
- PCA deviations
- Projected area on a certain plane


Histograms for Strut Thickness
Generate histograms for strut thickness. This allows you to, for example, determine the volume fraction of nodes and struts in foams or lattice structures.
Directional Variability
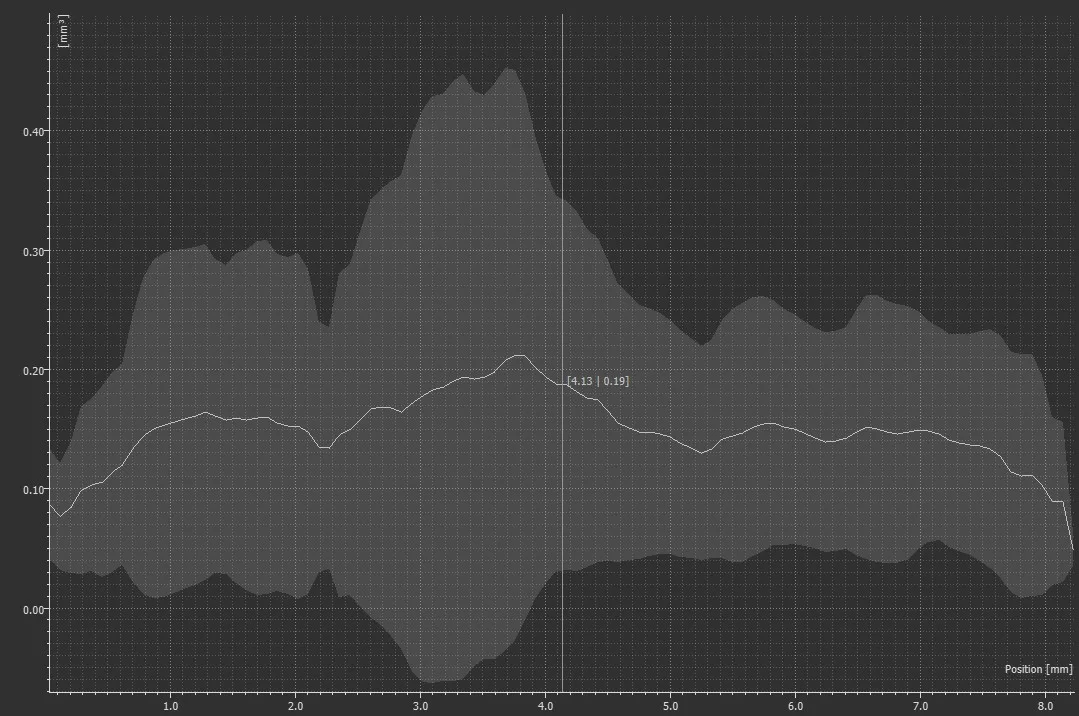
To investigate the directional dependency of the cell volume, among others, you can plot cell features over thickness in a certain direction using the directional variability plot. This is achieved by calculating the average of a cell feature over a layer and displaying this average (along with the minimum and maximum values) as a function of the layer's position.


Feature Plot
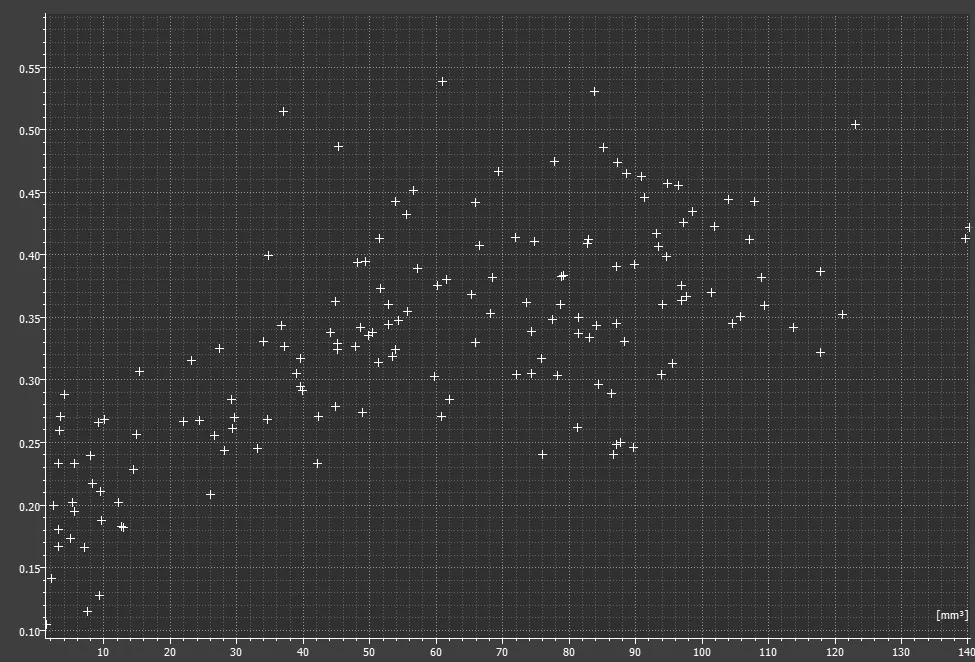
In addition to calculating and tolerancing parameters of individual cells, you can easily display dependencies between two parameters in a feature plot. For example, a plot of the the compactness against the volume for each individual cell may show that large cells are more spherical than small cells.
Benefits
Comprehensive
- Calculate cell sizes and strut thicknesses
- Characterize positions, sizes, shapes and orientations of all individual cells, faces, and struts in true 3D
- Use the same module for analyzing foams and powders
Efficient
- Handle large numbers of cells and condense the results in useful local and global statistics
- There is no need to separate cells manually
User-Friendly
- Perform analyses easily—no programming required
- Visualize cell features in 3D to provide an easy-to-understand representation of the data